
 16th
September 2025 (Tuesday)
16th
September 2025 (Tuesday)
 11:00 AM
Mountain Time (US and Canada)
11:00 AM
Mountain Time (US and Canada)
A CMMS dashboard that actually talks back, spot issues early and act fast.
Drive portfolio-wide alignment with real-time CMMS dashboards that surface insights and speed up decisions.
Why reporting in regular CMMS software fails decision-makers
Manual exports result in outdated reports that slow decision-making and reduce operational responsiveness.
Siloed data across systems makes it difficult to get a complete view of operations.
Reporting outside the CMMS limits the ability to investigate issues and identify underlying problems.
Teams waste hours gathering data from multiple tools, leading to delays and inconsistencies.
CFS transformed facility ops and gained total visibility with Facilio faster than ever, in just 4 months
Other CMMS dashboards show you what’s broken; But Facilio shows you what to fix, when, and why.
Telemetry and portfolio data analysis made easy
 Analyze large volumes of data on demand Quickly process high-resolution data across sites to spot inefficiencies and improve operational decisions.
- Drill down to record-level insights Zoom into multi-level data and go straight to the source, turning insights into action in just a few clicks.
- Automate reporting and enhance collaboration Schedule automated reports and enable dashboard screen casting with a public URL for easy team access.
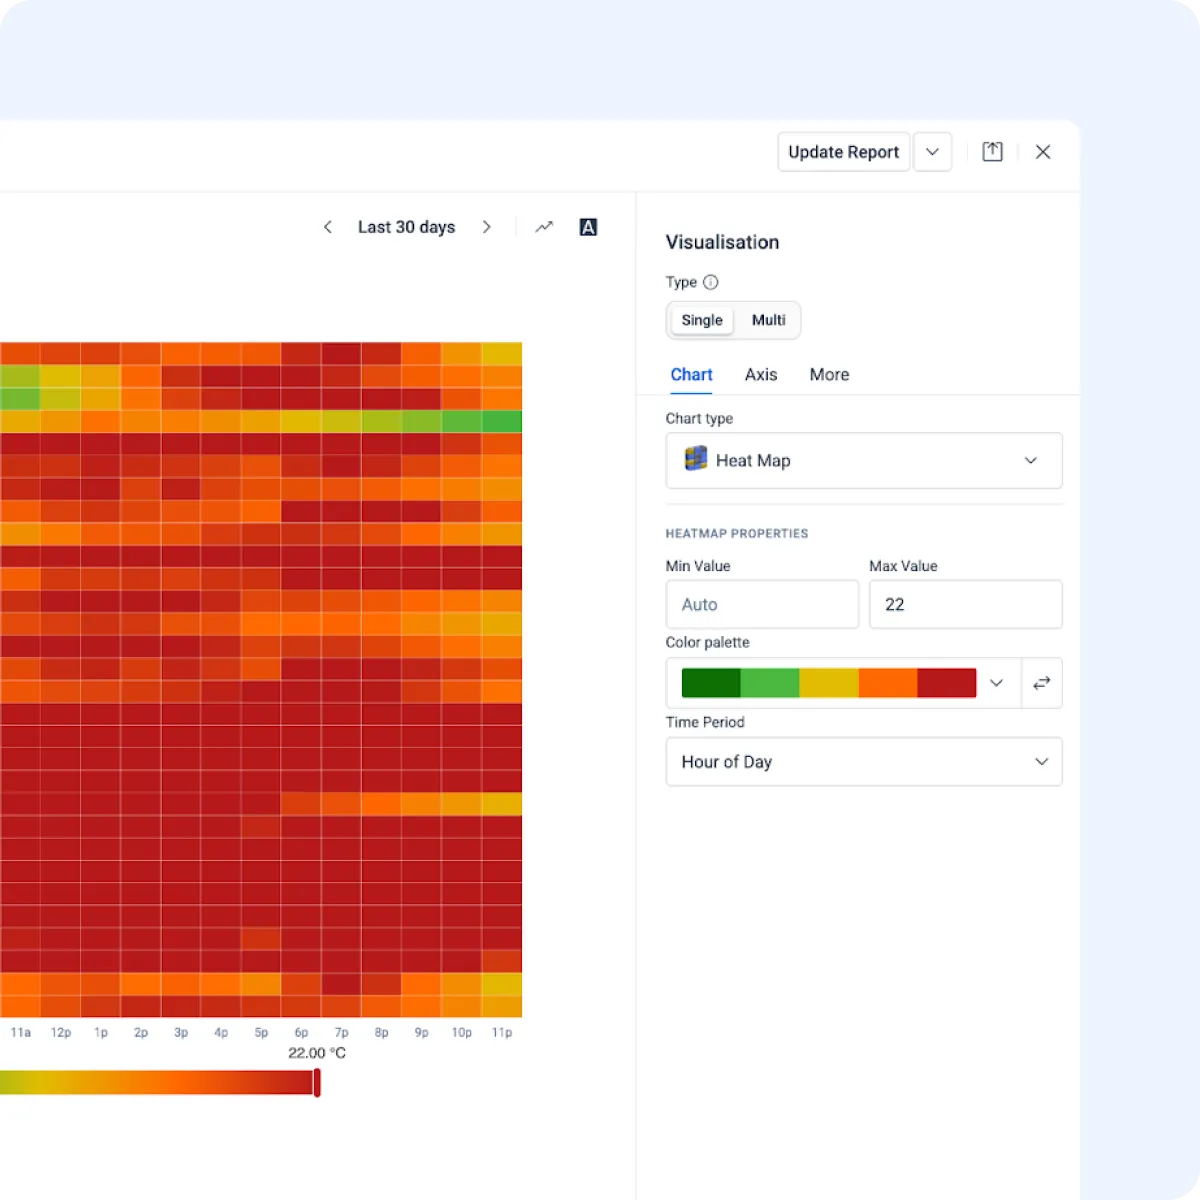
Make your data work visually
- Color-code thresholds and apply patterns to trends Set color thresholds and use patterns to highlight key metrics and surface trends clearly and quickly.
- Stay in control with intuitive chart formatting Highlight outliers and use dynamic charts like tree maps and heat maps to visualize trends in real time.
- Apply different criteria at each measure level Easily narrow your data set by applying filters and conditions at each level for more focused analysis.
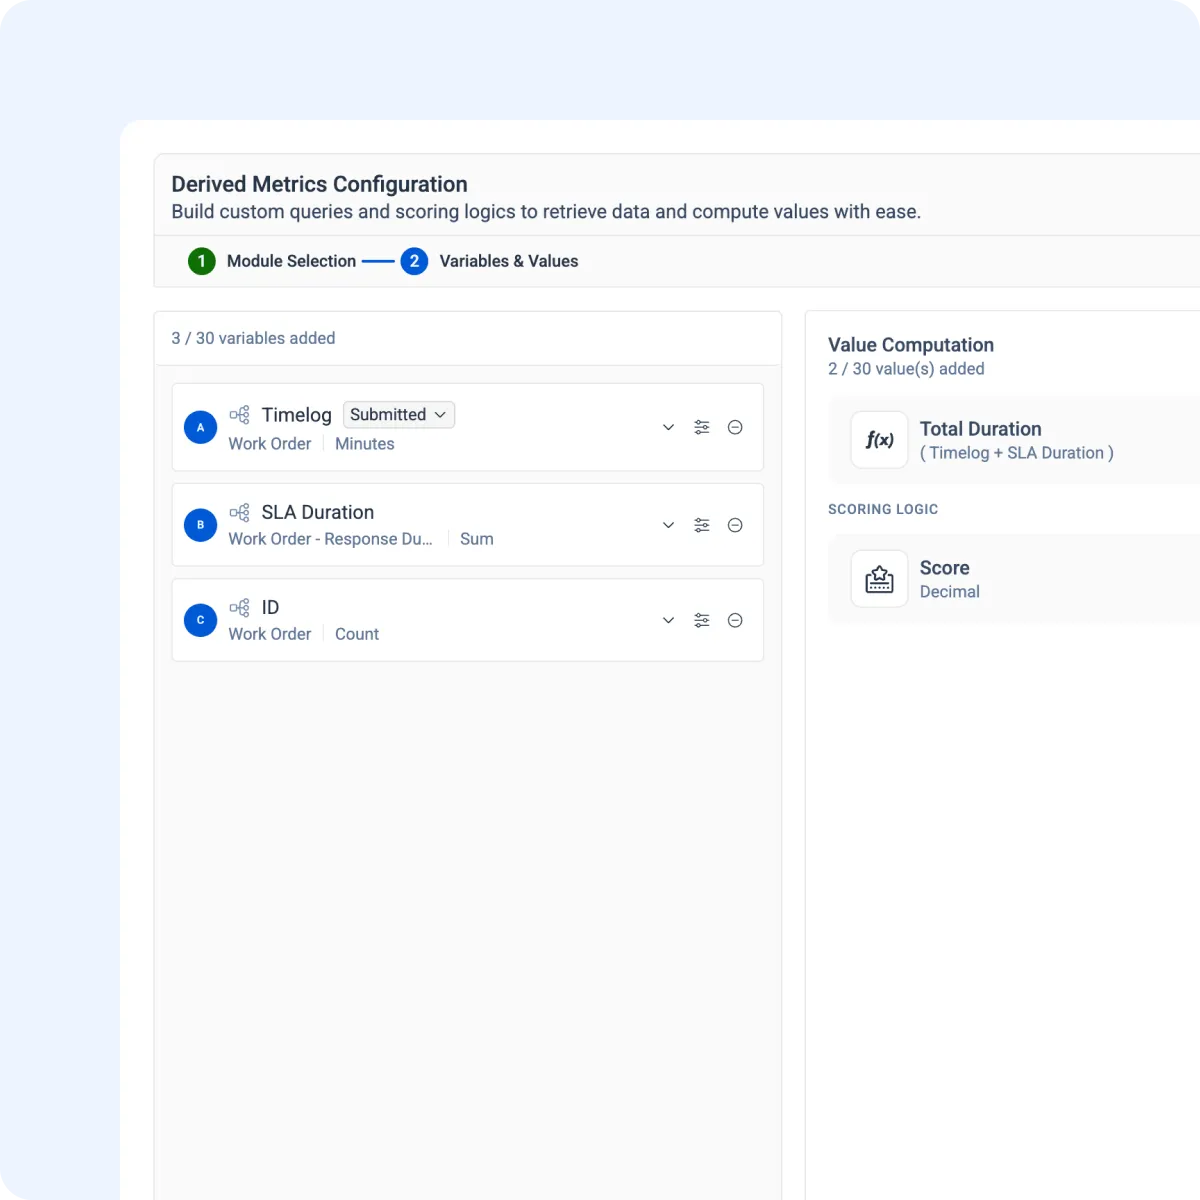
Create and track custom KPIs with ease
- Build your own KPIs without code Create composite scores, assign weights, and automate calculations for SLA tracking, vendor performance, etc.
- Set scoring logic and apply across use cases Define scoring rules and weights to track vendor, maintenance, and asset performance in one view.
- Link data across modules for smarter KPIs Combine work orders, audits, and vendor data using expressions to build precise, contextual metrics.
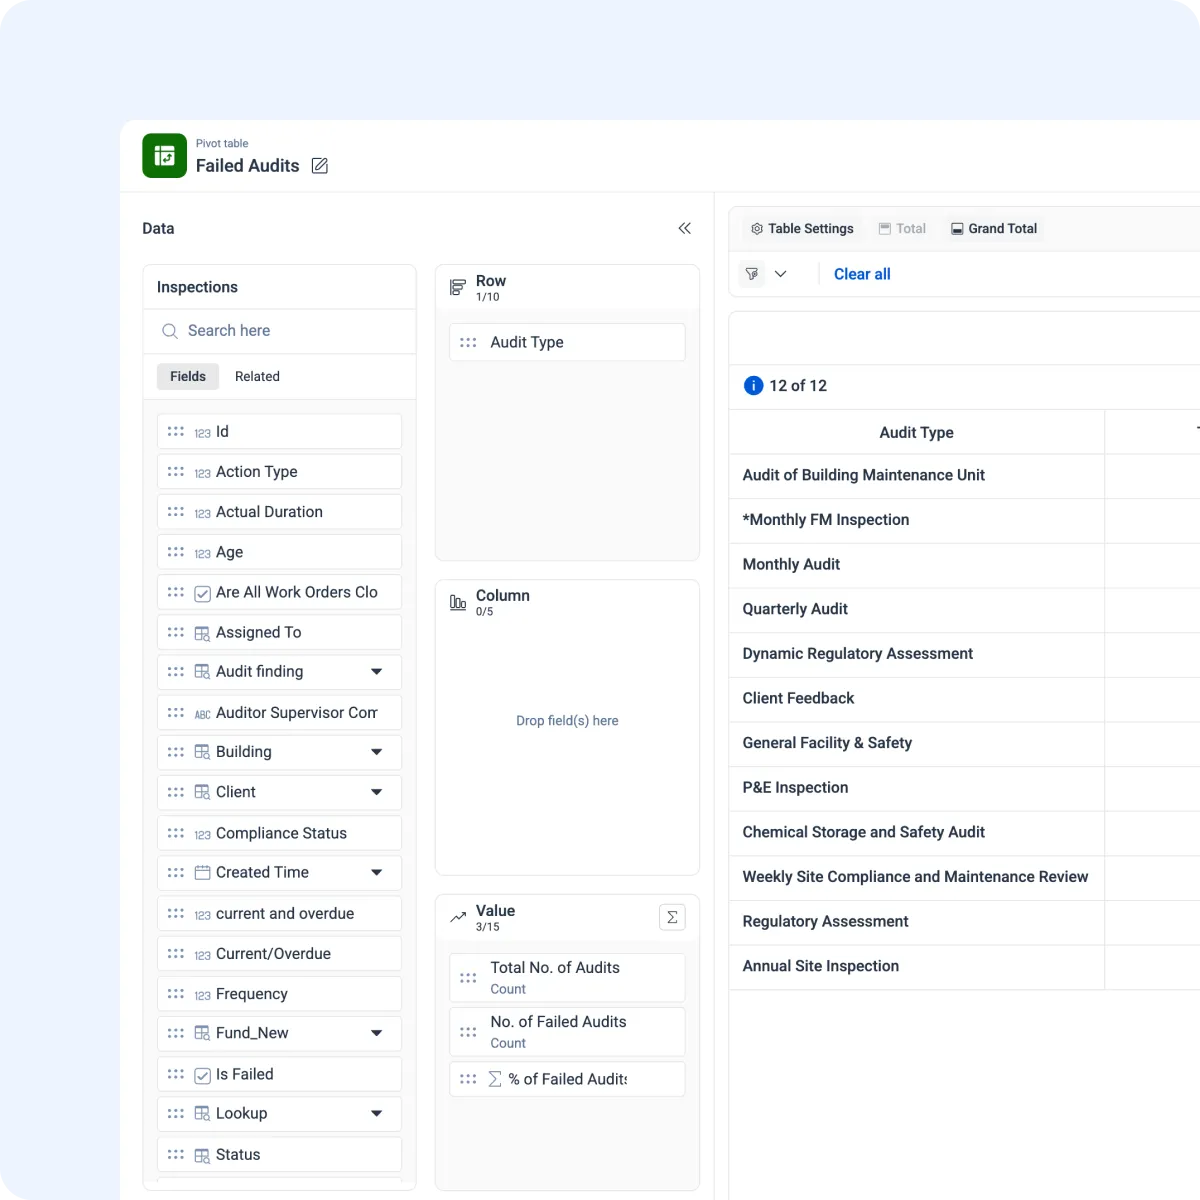
Unlock deeper insights with advanced pivot analysis
- Turn raw data into structured insights Organize telemetry or ops data into rows and columns using tree or table views for clarity.
- Enhanced formatting and data processing Use color coding and cell-level formatting to process large datasets and surface key insights quickly.
- Real-time and scheduled analysis for quick insights Run live or scheduled analysis to generate timely, high-precision insights across complex datasets.
Design powerful dashboards with drag-and-drop widgets
- Build dashboards effortlessly Create dashboards in minutes with an intuitive builder and widget control—no technical skills needed.
- Choose from a wide range of smart widgets Use pie charts, gauges, tree maps, heat maps, tables, and more to visualize operations at a glance.
- Control what users see with dashboard permissions Set access by role, location, or team. Make dashboards public, private, or read-only as needed.
Traditional Dashboard vs. Facilio’s Connected CMMS Dashboard
What’s holding you back and what’s possible when you switch
| Before Facilio | After Facilio |
|---|---|


“We sought a solution that would not only address our current requirements but also scale with us as we expand and our operational complexities increase. Additionally, user experience was a major consideration. We wanted a CMMS that was intuitive and user-friendly, ensuring that our team could easily navigate and utilize the system to its full potential without extensive training or support.”


Unlock real-time insights and drive smarter decisions with Facilio.