September 2020
What's new with Facilio
We've been working hard to infuse more power into your building management arsenal. Get set to embark on a fast lane to CRE portfolio growth because our data platform got even more powerful!
Get a quick but precise grasp of property conditions
Monitor dynamic information across diverse functions
Create a card or select from Facilio’s vast library of predefined cards to visualize any important metric that needs continuous tracking. Stay on top of the status of an asset, weather (humidity, temperature, carbon emission, and many others!), live data, readings of high-value and sensitive assets, energy loss, or any other KPI in real-time.
Interact with data bulletins to speed up action
Drill down to reveal more information by clicking on the cards. Open the trend report for an asset or space, link the card to a report, or even change/control setpoints - with one click.

Gain new insights in an instant
Narrow your focus onto data you are interested in
Avoid back-and-forth navigation within the dashboard to create multiple dashboards to do a task as simple as viewing a different property or team.
Flexibly set criteria like site, team, priority, status, operational area, and so on to fit all reports into the view you want.
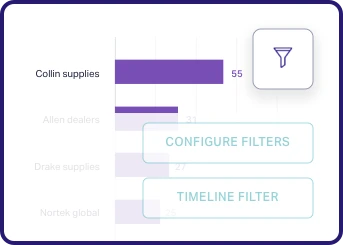
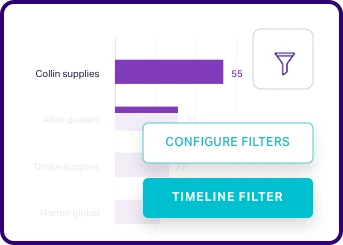
Compare your data for specific time frames seamlessly
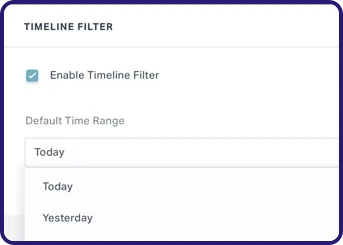
Using timeline filter you can now create and analyze custom reports based entirely on time intervals of your choice. Instead of enhancing individual time scales on different reports, now choose a desired time interval of data to apply to multiple reports at one go!
How It Works
Click on the dashboard-level filter
Select filter action
Choose what you want to view
Minimize steps to reach your frequently accessed information
Save time from reapplying interactions
Search for the information you regularly seek using different filters and save the results as a custom view. Once saved, the custom view will appear in the header.
Group related entities for easy-to-access insights
Apply custom views on any module - assets, planned maintenance, work orders, alarms, and so on to view entities satisfying a specific condition.


Easily trace the chain of requests for similar issues
Capture all relevant data about new work orders
As you try to create a new work order for a tenant request, the list of related work orders will be automatically displayed. Gain context with intelligent data correlation.
Know and act on recurring problems
When a tenant request arises, you can know if it’s a repeat complaint or totally new. Auto-escalate recurring issues. Easily track frequent comfort issues and gauge tenant satisfaction.