
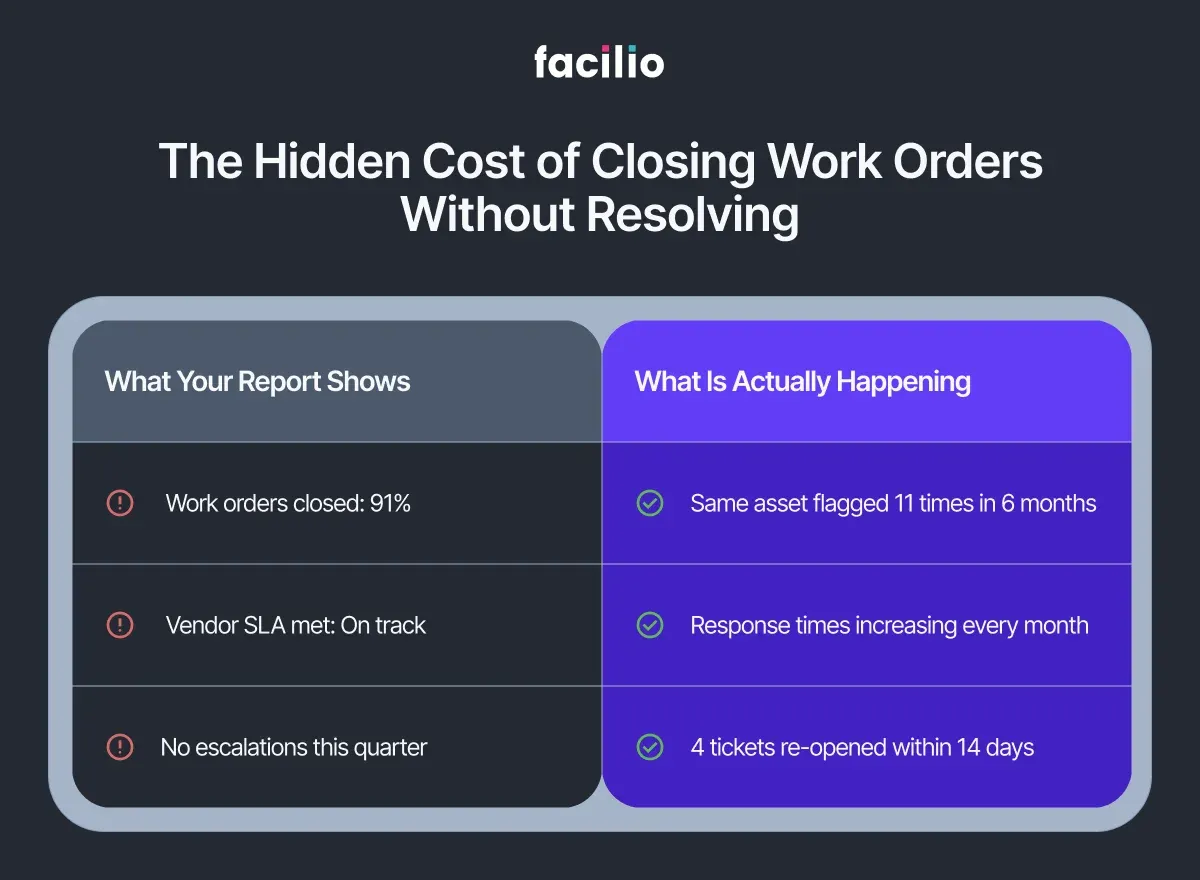
The monthly report looks fine. Work orders closed: 91%. Response times within SLA: mostly green. On paper, operations are running.
But pull up the asset log for the air handling unit on Level 4. It has generated eleven work orders in the past six months. Eleven separate tickets. Eleven closures. Eleven times someone marked the job done.
The unit is still underperforming.
This is not an unusual situation. It is an extremely common one and it exposes a gap that exists in almost every FM operation, regardless of portfolio size, system quality, or team experience.
Work orders are the backbone of facilities management. They track what was requested, who attended, and when the job was closed. But in most organisations, that is where their value ends. They are used as task records, not as operational intelligence.
The data tells a much richer story. Most teams never hear it.
To understand why, it helps to look at what work orders are actually built to capture and what they are not.
Why Work Orders Were Never Designed to Show Patterns
Every work order captures the same core information:
- The request description
- The assigned technician or vendor
- Open and close timestamps
- A category code and priority level
That data does its job. It keeps operations moving, tracks accountability, and gives managers a daily activity view. For task management, it works exactly as intended.
But task management and operational intelligence are not the same thing.
What work orders do not capture — not in any structured or readable way — is pattern. They will not show you:
- That the same fault has appeared on the same asset across fourteen separate tickets
- That a vendor's response times have been quietly declining for three months while still clearing SLA thresholds on paper
- That a spike in reactive volume on a specific system points directly to a gap in the planned maintenance schedule
Each ticket is read as its own event. Opened. Assigned. Closed.
Think of it like reading a book one sentence at a time, then closing the page after each one. Every sentence is technically complete.
The story — the pattern, the cause, the thing that explains what keeps happening — never comes into view.
Work orders are the richest operational dataset most FM teams generate. In most organisations, they are used only to confirm that something happened. Not to understand why it keeps happening.
The patterns are there. They just need to be read differently.
What Are the Five Patterns Buried in Your Work Order History?
If you looked at your last twelve months of work order data not as a list of completed tasks but as a continuous operational record, here is what you would likely find.
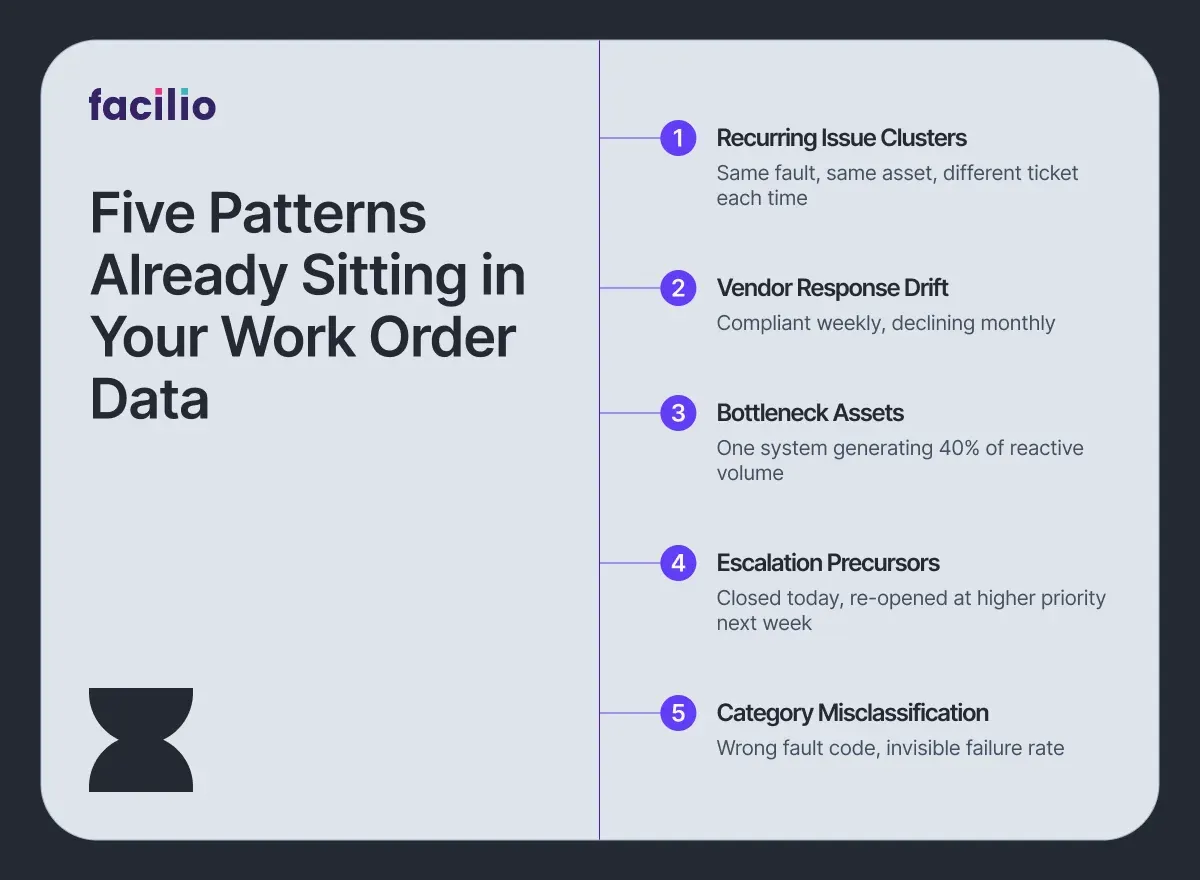
1. Recurring Issue Clusters: The same fault type appearing on the same asset across multiple tickets — each logged separately, each closed independently. No single ticket looks alarming. Taken together, they point to a systemic failure that reactive maintenance is repeatedly patching but never resolving.
2. Vendor Response Drift: A contractor whose response times meet SLA thresholds every individual week, but whose average has been creeping upward for four months. Measured ticket by ticket, it is compliant. Measured as a trend, it is a relationship in slow decline.
3. Bottleneck Assets: Certain equipment or building systems generating a disproportionate share of reactive ticket volume. Not because they are poorly maintained on paper, but because the planned maintenance frequency no longer matches how the asset is actually being used.
4. Escalation Precursors: Work orders that are closed, then re-opened within seven to fourteen days at a higher priority level. This pattern, closure followed quickly by re-escalation, is one of the most reliable early indicators of an impending formal complaint or SLA breach.
5. Category Misclassification: Tickets logged under the wrong fault code, either through habit or system design. The result is that failure rates on specific assets appear lower than they actually are and the problem stays invisible in any report that relies on category filters.
None of these patterns require new data. They are already sitting in your work order history. The question is whether anyone is reading for them.
Most teams are not — and the reason comes down to how work order data is typically analysed.
See which of these patterns are hiding in your work order data.
Explore OpsVision NowWhat Does Better FM Performance Actually Look Like With AI?
The patterns identified in the previous section are not difficult to understand. They are difficult to see — because seeing them requires reading across thousands of work orders simultaneously, tracking trends over months, and connecting signals spread across assets, vendors, and buildings.
No FM team has the bandwidth to do that manually. Not at scale, and not consistently.
This is where AI changes the equation, not by replacing the FM team, but by doing the reading that no team can sustain on their own.
Facilio's OpsVision analyses work order history continuously across sites, vendors, asset categories, and time periods. For FM leadership, this means a structured operational intelligence view updated weekly, without anyone having to pull a report. In practice, it does four things:
- Clusters recurring issues across your portfolio
- Flags vendor SLA drift before it becomes a pattern
- Identifies bottleneck assets that keep reappearing on reactive logs
- Surfaces an operational intelligence summary for leadership on a weekly cadence
Here is what that looks like in practice. OpsVision identifies that a chiller unit across three of your buildings has appeared on reactive logs fourteen times in six months — logged under different ticket categories each time.
To the team reviewing individual tickets, these look like separate, unrelated events. OpsVision reads them as a single systemic asset risk and flags it before the fourteenth ticket becomes a formal escalation.
Critically, none of this requires replacing your existing systems.
OpsVision layers on top of your current CMMS platform. Your work order data stays where it is — no migration, no replatforming, and no new system for operational teams to learn.
The data your operation already generates becomes the intelligence your leadership has been missing. And when that intelligence is available, it changes what FM leaders can actually do.
How Does AI-Driven Work Order Intelligence Change FM Decision Making?
When work order patterns are visible, the way FM leaders manage their operations changes in concrete, measurable ways.
1. Fewer Repeat Interventions: Systemic failures are caught and addressed before the fifth reactive callout, not after. When a recurring issue cluster is identified early, the response shifts from patching to resolving and the asset stops appearing on the reactive log every few weeks.
2. Evidence-Based Vendor Accountability: Response time trends and closure quality data replace opinion and gut feel in vendor conversations. QBRs become structured performance reviews, not negotiated narratives. The data either supports the vendor or it does not.
3. Smarter PPM Scheduling: Recurring reactive patterns on specific asset types are a signal that planned maintenance frequencies need review. When the same system keeps generating reactive tickets between scheduled visits, the schedule is wrong, not the asset.
4. Leadership Reporting That Holds Up: FM directors present operational performance with structured data rather than manually compiled summaries or anecdotal updates. Boards and senior stakeholders get a consistent, defensible view of portfolio health.
5. SLA Risk Surfaced Before Breach: Escalation precursor patterns give FM teams a window to intervene before a breach is recorded and a penalty is triggered, shifting the posture from reactive defence to proactive governance.
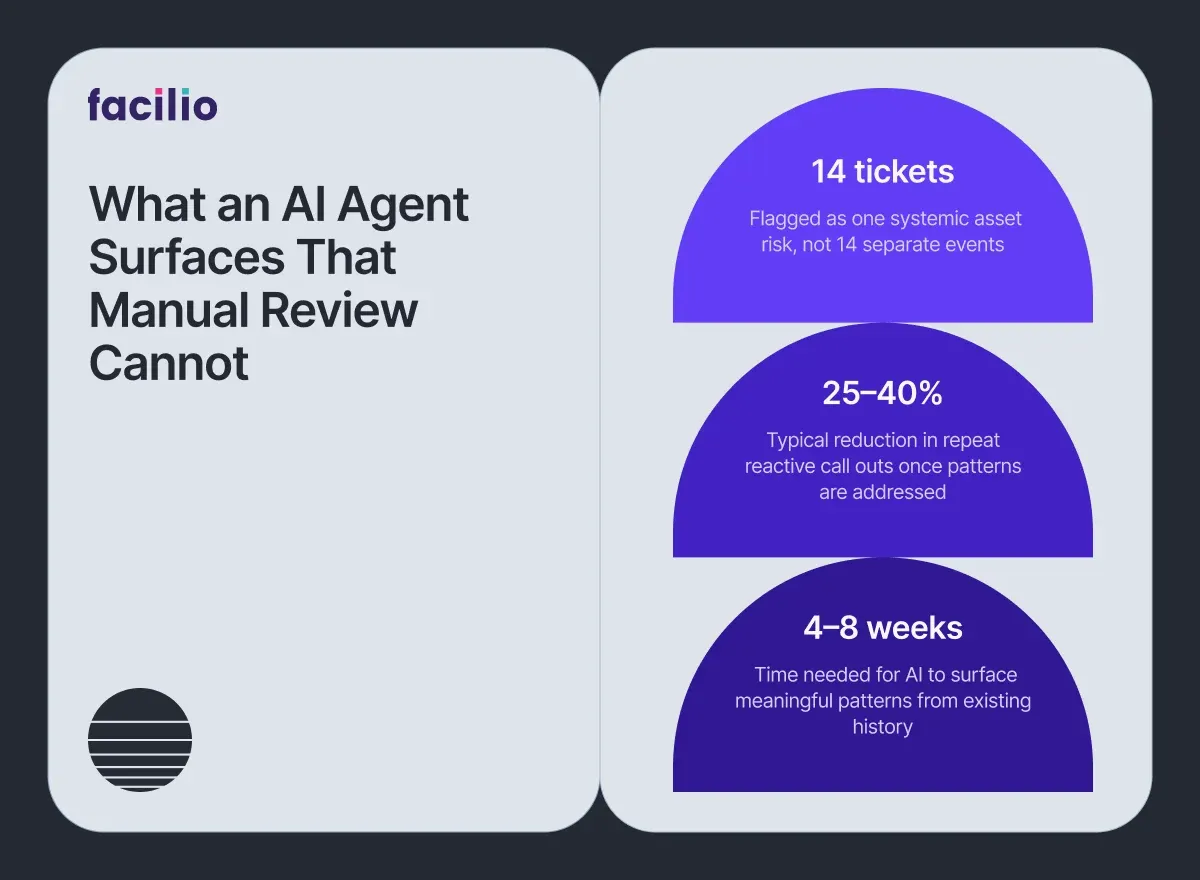
In portfolios where recurring issue patterns are identified and systematically addressed, reactive call-out frequency on flagged assets typically reduces by 25–40% within a quarter. That is not a guarantee, but it reflects what structured pattern visibility makes possible.
The data has always been there. The difference is finally being able to act on it.
Find out what pattern intelligence looks like for your portfolio.
Talk to our teamDeploy an AI Agent That Reads What Your Team Cannot.
Most FM teams are not missing data. They are missing the layer that reads it.
Your work orders already contain everything — recurring failures, vendor drift, SLA risk, bottleneck assets. The only thing standing between your operation and that intelligence is an AI agent that knows how to look.
Before Facilio AI: Patterns go unread. Failures repeat. Escalations arrive without warning.
After Facilio AI: Recurring issues flagged automatically. Vendor trends visible weekly. SLA risk surfaced before breach.
And getting there does not require changing what is already working.
Already on Facilio?
OpsVision activates on your existing work order history. No new infrastructure. Live within days.
On Maximo, Archibus or any other CMMS?
Facilio's AI agents connect as a standalone intelligence layer.
No API? Facilio still connects. No rip-and-replace. No disruption.
The shift to intelligent FM operations starts with the data you already have.
Your data is ready. Are you? Start reading your work orders differently.
Deploy OpsVision on Your CMMS.
What Do FM Teams Ask Before Deploying an AI Agent?
1. Does AI replace our work order system?
No. OpsVision layers on top of your existing CMMS or CAFM. Your work order data stays exactly where it is. There is no migration, no replacement, and no disruption to how your team currently operates.
2. What work order data does AI actually need?
The basics are more than enough — ticket type, asset reference, open and close dates, assignee, status, and closure notes. No custom data model is required, and no additional data capture needs to be introduced before deployment.
3. How long before patterns become visible?
In most cases, four to eight weeks of historical data is sufficient to surface recurring issue clusters and vendor trends. If your CMMS holds months or years of existing records, meaningful patterns typically emerge within the first week of analysis.
4. Can this identify underperforming vendors without bias?
Yes. The analysis is based entirely on measurable signals — response time trends, re-open rates, and closure quality — not subjective assessment. The output is a data position, not an opinion.
5. Does this work across multiple buildings?
Yes. In fact, cross-site analysis is where AI adds the most value. Systemic issues often appear differently across locations but share the same root cause. AI identifies the connection that site-level reporting misses.
About the Author
More from Facilio