Dashboards
Dashboard is a visual display of data whose primary intention is to provide information at a glance. Dashboards are extremely helpful when summarizing data and turning them into graphical insights. The information gained allows the facility managers to analyze inefficiencies, align targets with potential strategies, identify trends, examine statistical data, and so on.
The application allows you to represent data using a variety of visualization techniques, such as cards, graphs, line graphs, and pie charts. Text and images can also be added to customize the dashboard to meet specific needs, making it easier for the user to visualize multiple data sets in a single frame. You can view/access details of configured dashboards on your mobile device. To access the available dashboards,
Click the
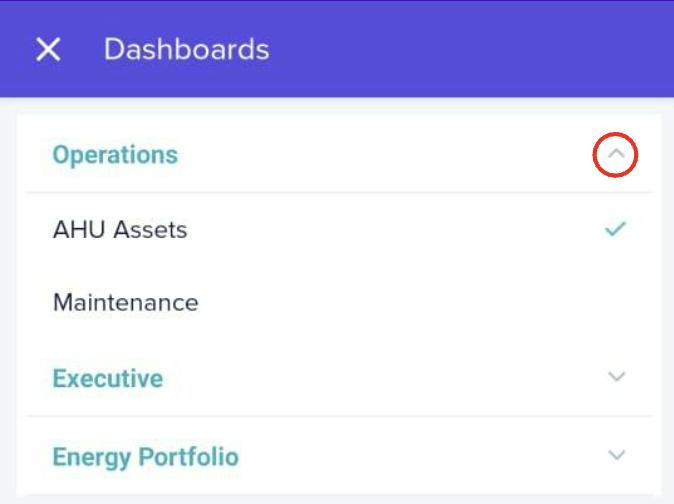
 (Dashboard) icon from the bottom panel and then expand the dropdown at the top of the screen. The available dashboards are displayed as shown below.
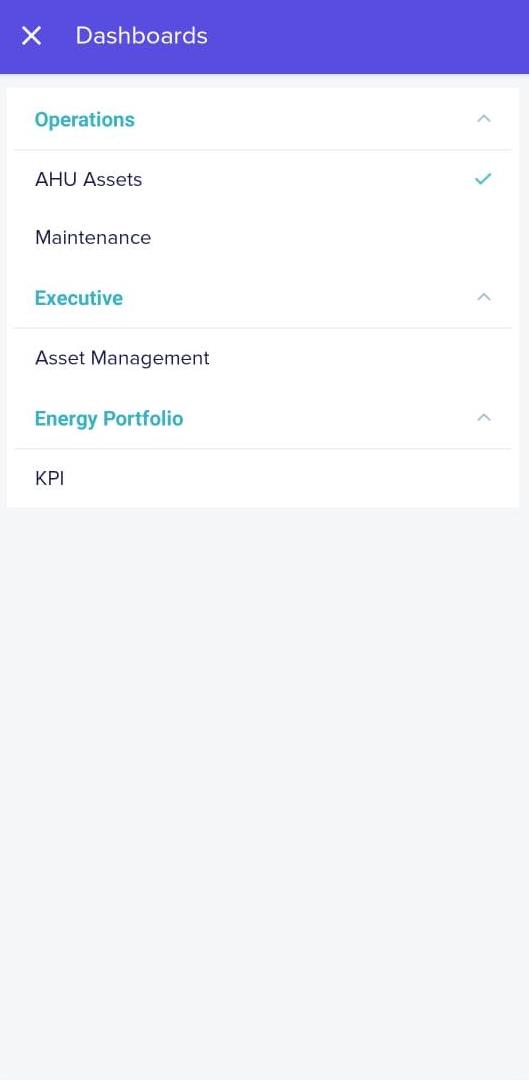
Select a dashboard from the list. The results are populated in the main screen.
Example: If you select AHU Assets, the dashboard will be populated with the configured widgets as shown below.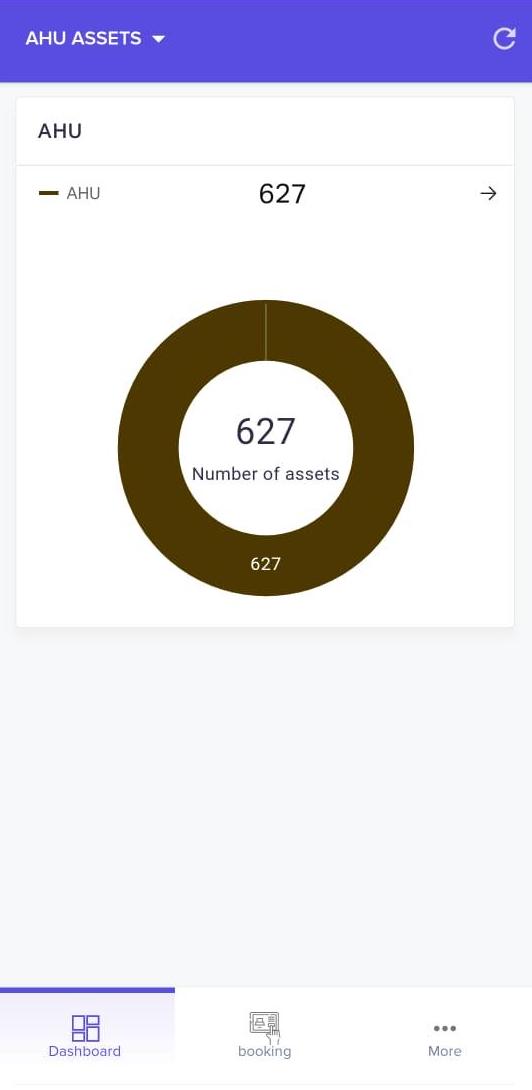
You can use
 icon corresponding to an item in the dashboard to view the dataset based on which the representation was generated.Example: If you click the icon in the above screen, you will be navigated to the AHU Assets view of the Assets module, where the list of 627 AHU assets are displayed.
You can also switch to other folders or dashboards from the dropdown list as shown below.