Diagnostics
Diagnostics are intelligent monitoring techniques deployed to determine the causes and solutions for problems in an organization, leading to a relevant choice of rectification process. An efficient diagnostic system is critical to prevent wasting time and energy on the wrong course of corrective actions.
In general, a diagnostic model focuses on,
Identifying the significant metrics in an organization
Framing effective rules to monitor the metrics
Diagnosing the possible faults that may lead to failures, and their causes
Rectifying the faults with appropriate remedial solutions, thereby optimizing the business
Ultimately, it is a framework or systematic approach to watch the health of a business.
Diagnostics in Facility Management
As a part of facility management, the diagnostic techniques help proactively discover building system problems and derive solutions before they lead to excessive loss of resources, unexpected breakdown, system failure, or occupant discomfort in a facility, saving time and energy. A considerable amount of the energy consumed in commercial buildings gets wasted because of equipment failure or operational faults. These techniques identify irregularities in the performance of vital equipment such as chillers, boilers, elevators, motors, exhaust fans, pumps, and so on. Consequently, the recent advancements in diagnostic systems translate these irregularities into real-world faults and notify the respective operators through alarms. All these are possible by transforming complex utilization data obtained through BMS (Building Management System) into actionable or predictive information, delivering real business value for organizations.
Diagnostics in Facilio
Facility management emphasizes proactive maintenance rather than reactive in order to deliver seamless service. And the facility managers prefer reading-based maintenance over time-based maintenance to curb cost while adopting potential maintenance ideas (read the Readings in Proactive Maintenance section in the Meter Readings feature for more information). This is aided through the Diagnostics module of the application, which allows the facility managers to configure the diagnostic rules ideal for the facility. Subsequently, it identifies the alarm conditions in a facility and alerts the facility managers on the inconsistencies based on the rules.
In general, alarms are triggered to notify the attention-seeking phenomenon of assets in a building.
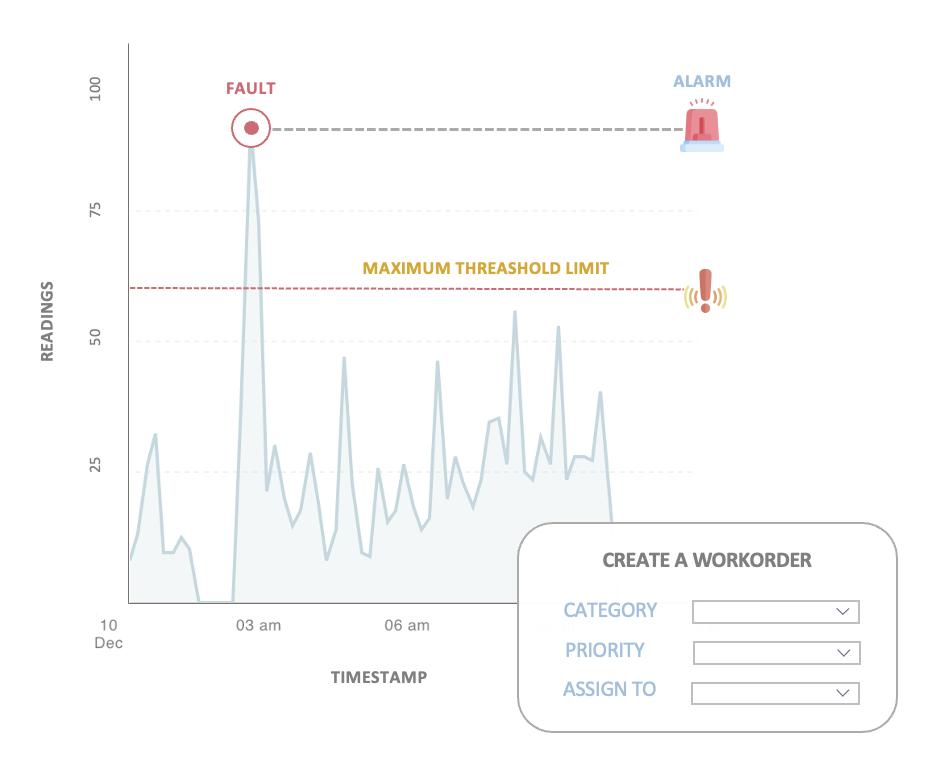
Certain alarms might need mere maintenance. Whereas, if the fault is severe the respective asset/space requires appropriate corrective actions to be taken instantly to overcome the situation. To resolve the purpose, the Diagnostics module converts the critical alarms into work orders. The work orders in turn are assigned to the concerned teams for necessary actions and tracked toward completion. Read the Maintenance feature for more information.
Working with Diagnostics
The advanced fault detection and diagnostics methodology of the application helps identify the root cause of malfunctions and streamlines the troubleshooting process, even with complex building systems.
To navigate to this module, click the ![]() (Diagnostics) icon in the sidebar menu. The FAULTS section appears by default as shown below.
(Diagnostics) icon in the sidebar menu. The FAULTS section appears by default as shown below.
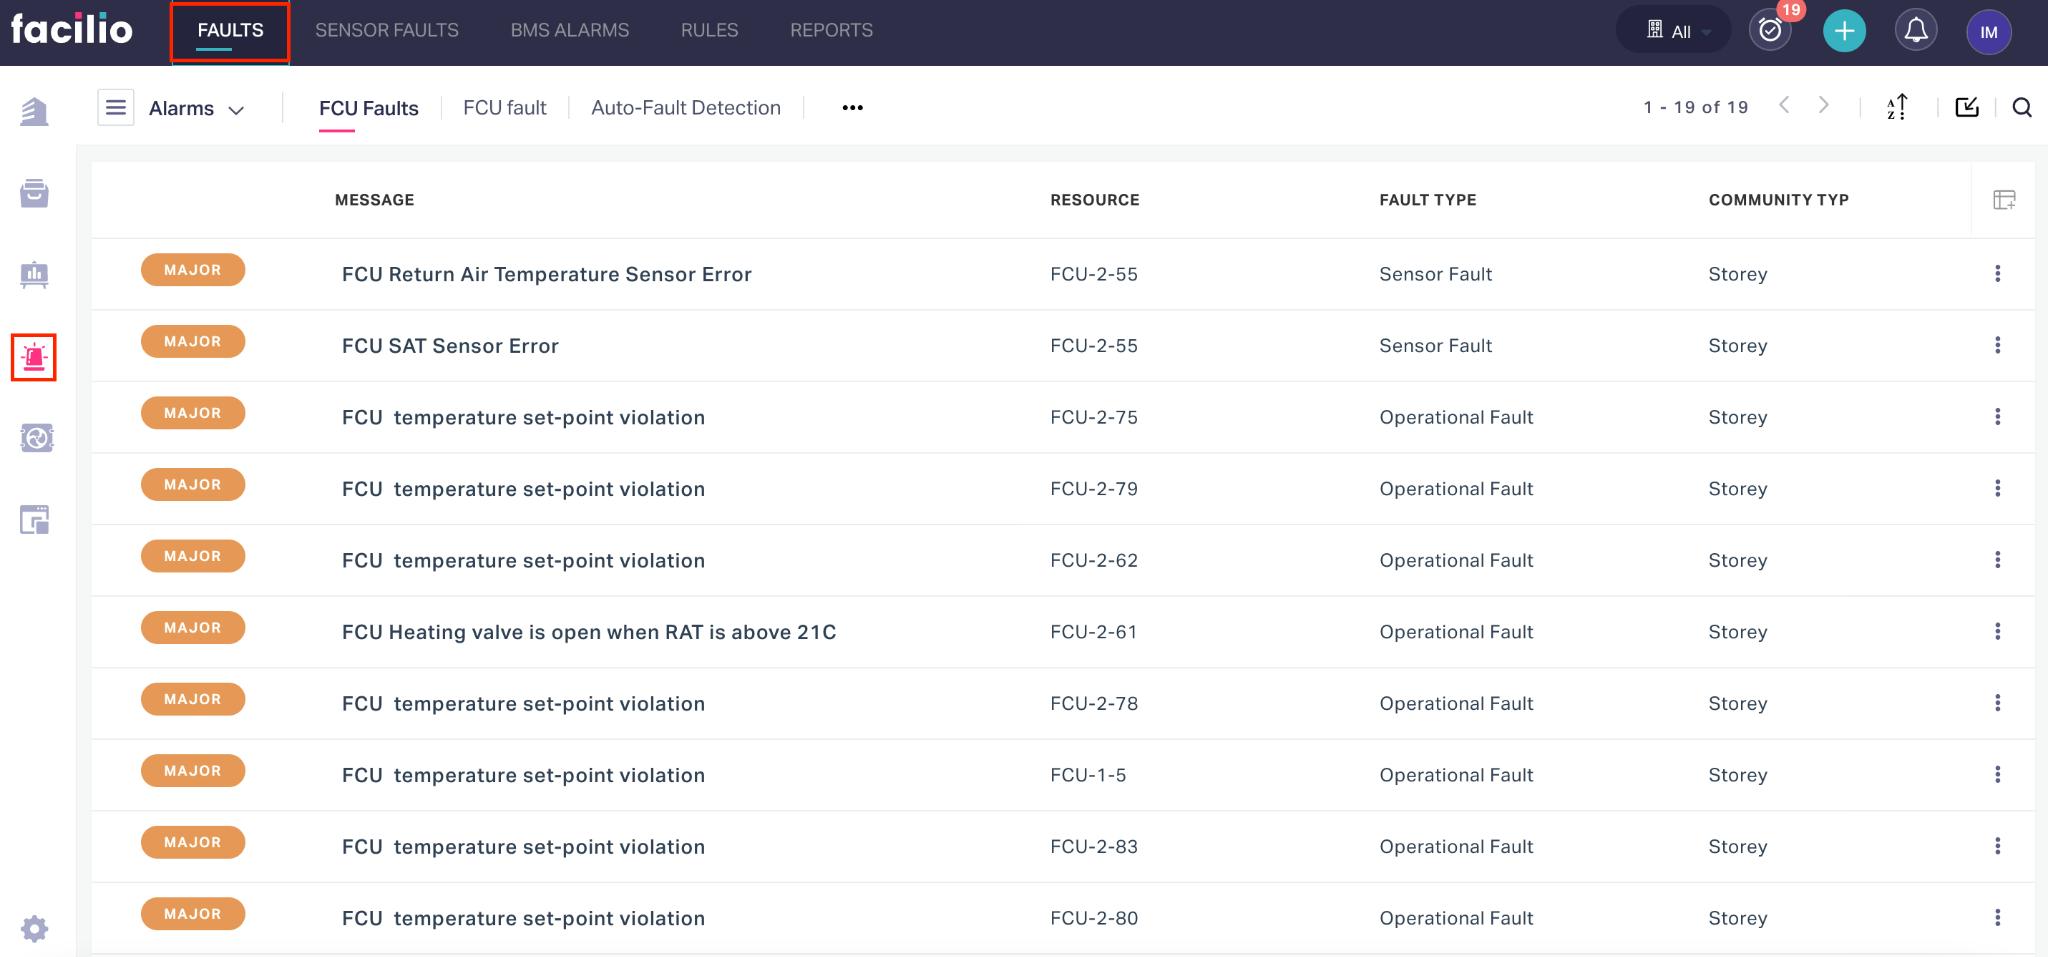
The upcoming sections illustrate how to manage faults and alarms, and customize alarms, alarm actions, and so on.
Managing Faults and Alarms
Faults represent anomalies in the system. Each fault triggers an alarm, seeking the facility managers to execute required corrective actions. Alarms are categorized as major, minor, critical, warning, and info defining the severity level. This categorization helps prioritize faults and avoid unplanned downtime in case a facility manager has too many alarms triggered in a short duration.
Types of Faults and Alarms
The faults and alarms in an organization are grouped into the following sections, based on their nature.
Faults (General Faults)
This section lists the real-time defects that are identified analyzing the readings recorded in the application. A fault is raised when any reading associated with a facility deviates from the defined criteria. More precisely, the application triggers a fault based on the alarm conditions configured in the RULES section. Read the Managing Alarm Rules topic to know more about alarm rules and conditions.
Sensor Faults
This section displays the faults generated due to the deviations observed in the readings recorded by the sensors. The sensor faults occur when a sensor produces incorrect readings, due to physical damage, malfunction or loss of communication between the sensors and the controllers, and much more. Inaccurate sensor readings might even lead to system failure as sensors are an integral part of building systems.
Note: The conditions for identifying a faulty sensor are configured by the administrators.
BMS Alarms
This section fetches and displays the alarms triggered due to inconsistencies in the BMS (Building Management System) readings. BMS is a control system that regulates building subsystems such as HVAC, power systems, and so on to maximize their efficiency. The conditions for BMS alarms are predefined in this system. For example, the temperature, pressure, humidity, and the corresponding exhaust temperature of the HVAC system are connected to the BMS system. When their value exceeds the defined limits, a BMS alarm is generated.
Viewing Fault Details
Eventually, clicking on a fault displays the detailed information about the fault, such as the history of its occurrence, root cause, and other insightful information.
The details displayed are grouped into the following sections for better clarity.
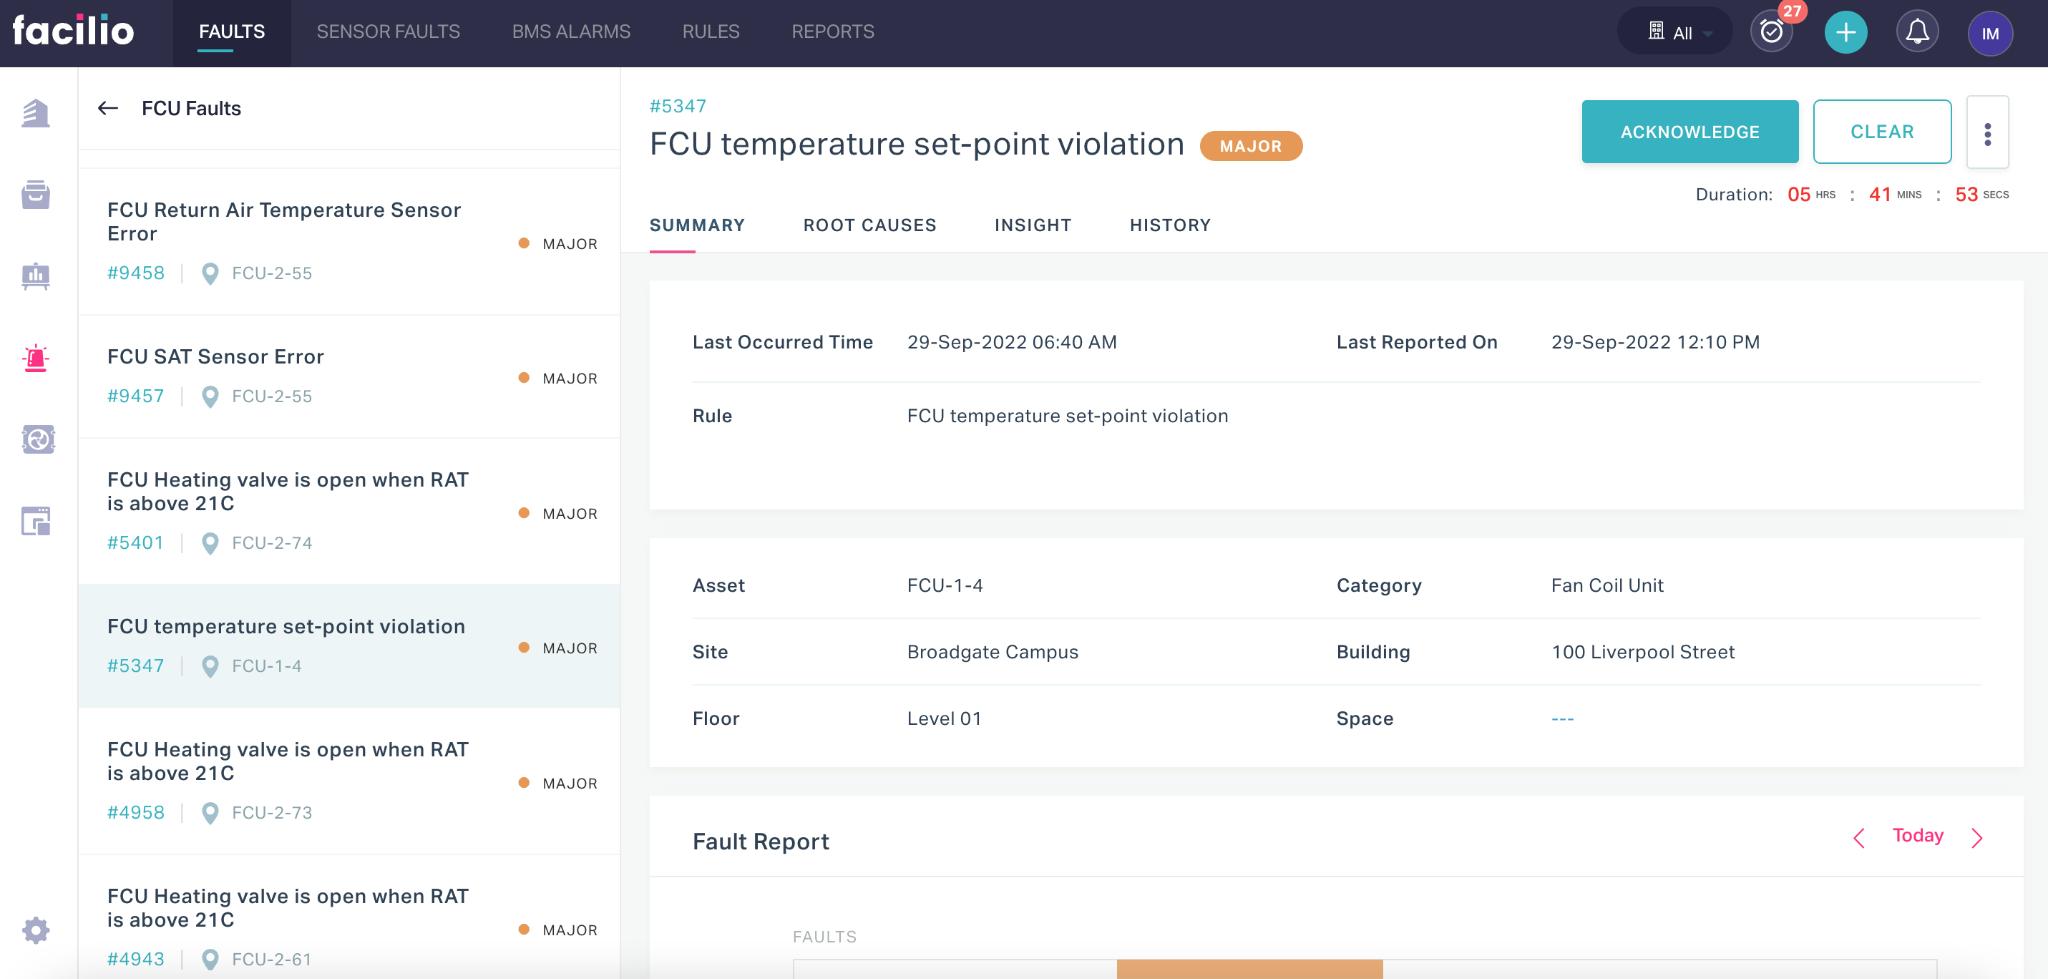
Summary
The SUMMARY section displays the basic information about the fault alarm. This includes the occurrence time, the rule based on which it arised, the associated asset and space, and other details.
The Comments field at the bottom of this section allows you to add specific notes related to the alarm.
Root Causes
The ROOT CAUSES section lists the varied reasons for the occurrence of the fault. This information provides an opportunity to fix the fault permanently by rectifying the possible sources that stimulate the instance of the fault.
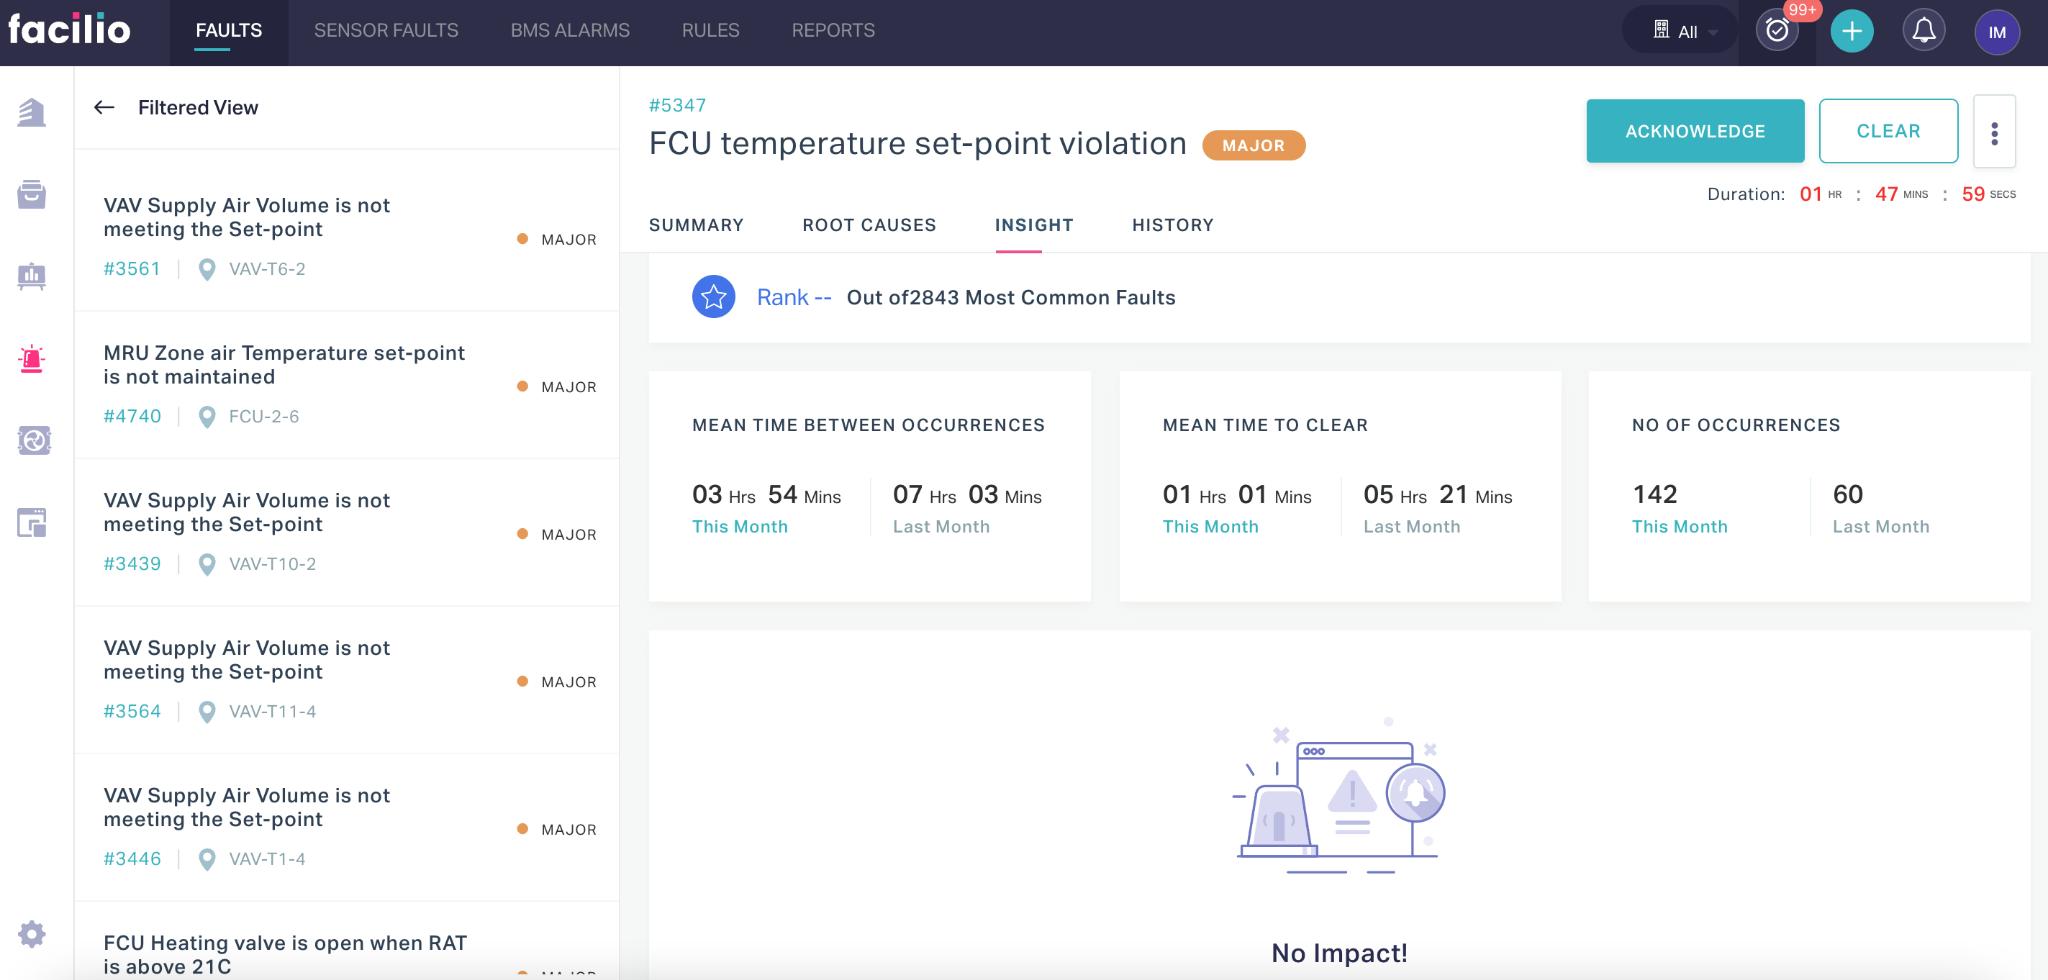
Insight
The INSIGHT section primarily indicates the ranking of the fault based on its number of instances, if it is identified to be a common fault.
Note: The faults with high frequency rate are counted as common faults.
In addition, this section shows the time taken to clear the fault, average frequency of its occurrence, and the total number of occurrences recorded. Also, it lists the operational impact due to the specific fault.
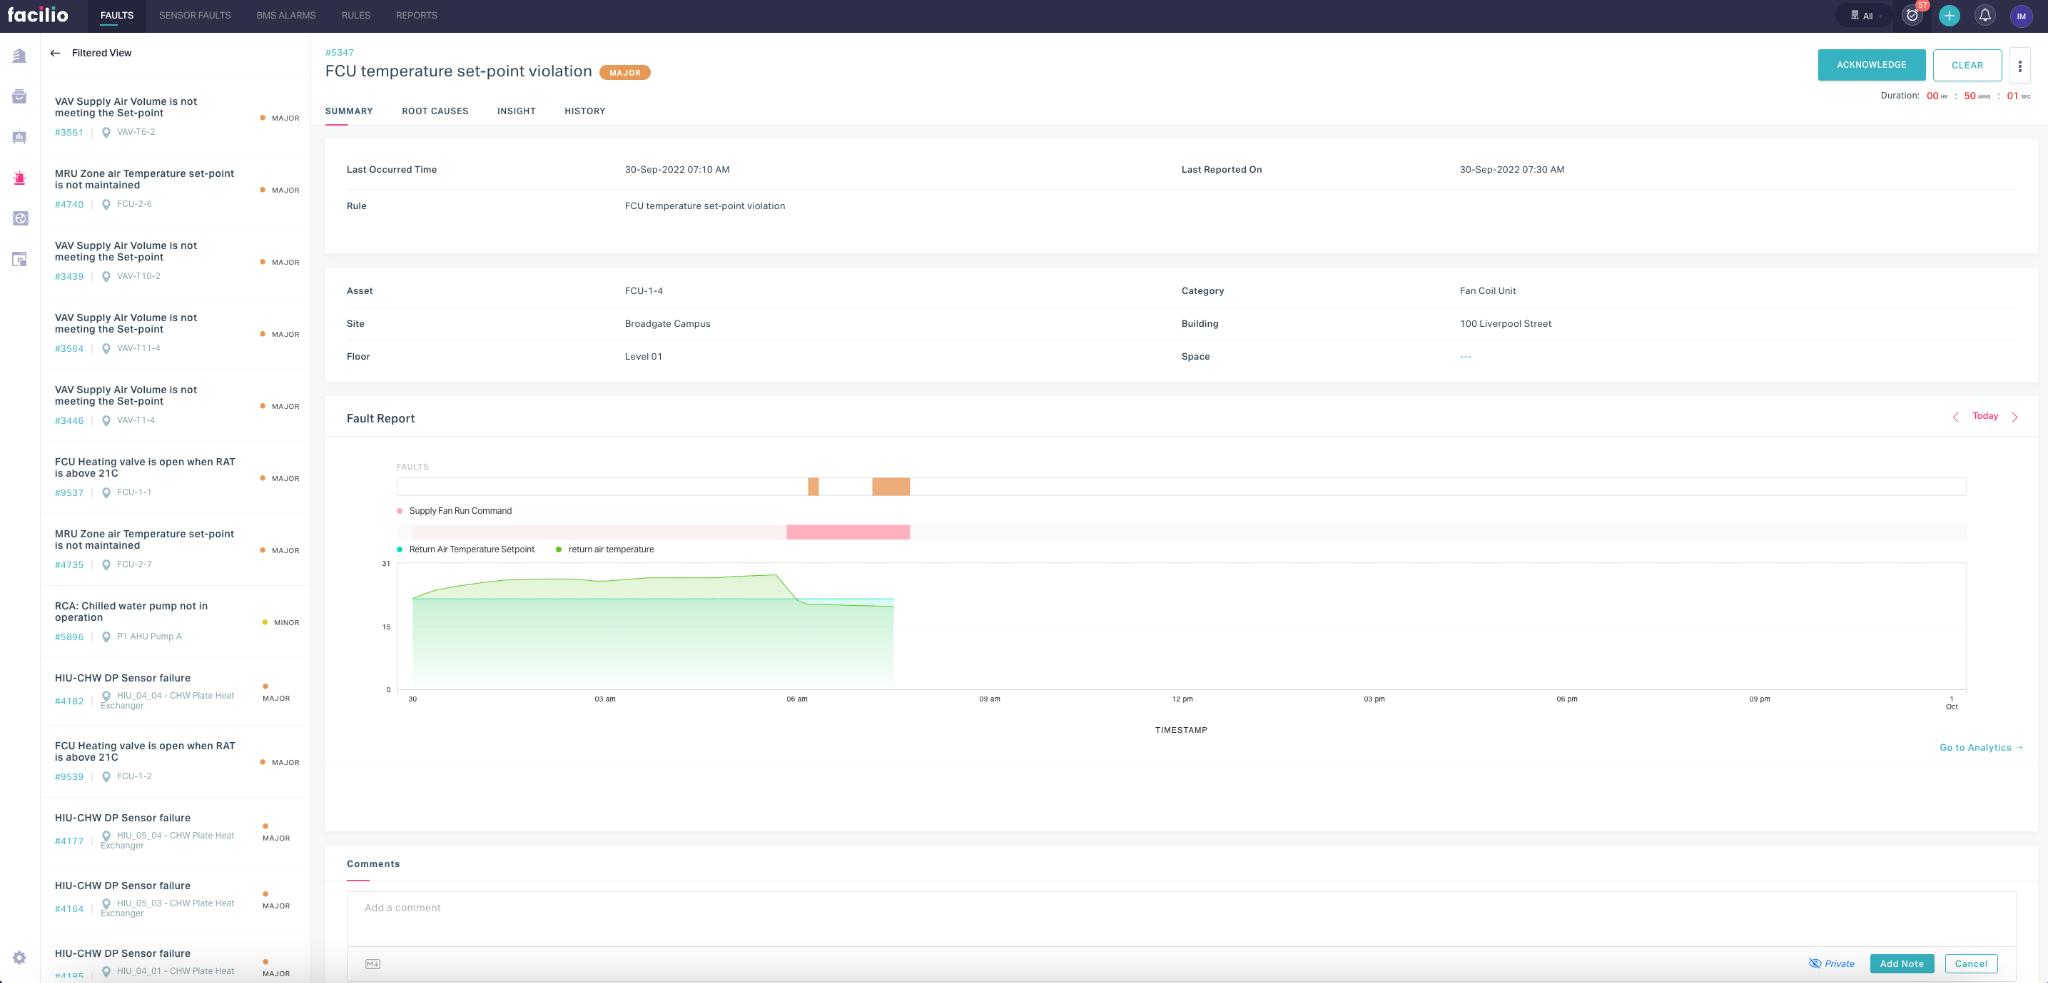
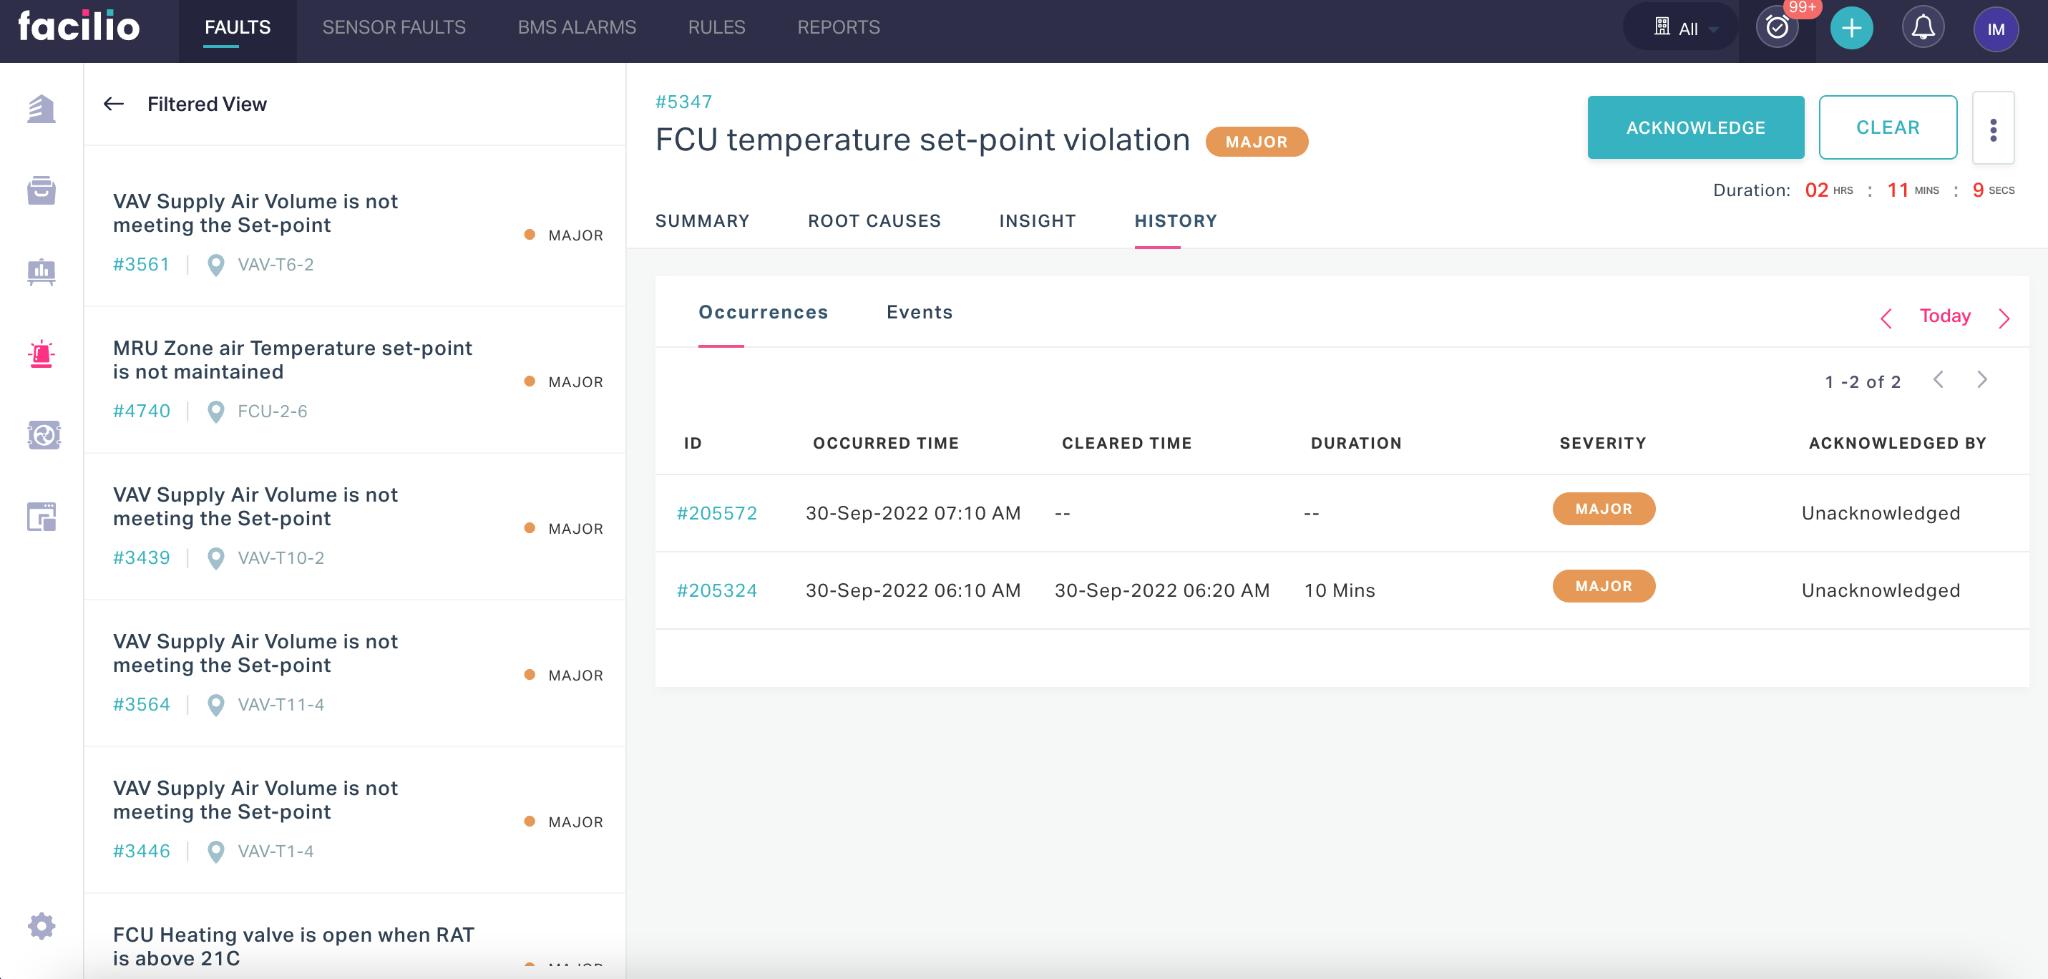
History
The HISTORY section depicts the occurrences and events of alarm for a definite time period. You can use the date picker (  ) to customize the time range for observing the alarm occurrences and events.
Acknowledging an Alarm
Acknowledging an alarm is announcing to other users that you have seen the alert and are aware of the situation. It's typically to ensure that a critical event never goes unnoticed.
Acknowledging an alert doesn't make the concerned personnel responsible for solving it. You can click on the ACKNOWLEDGE button corresponding to a fault to express that its cause will be addressed. As a result, the acknowledgment status is updated in the list view of the faults, as shown below.
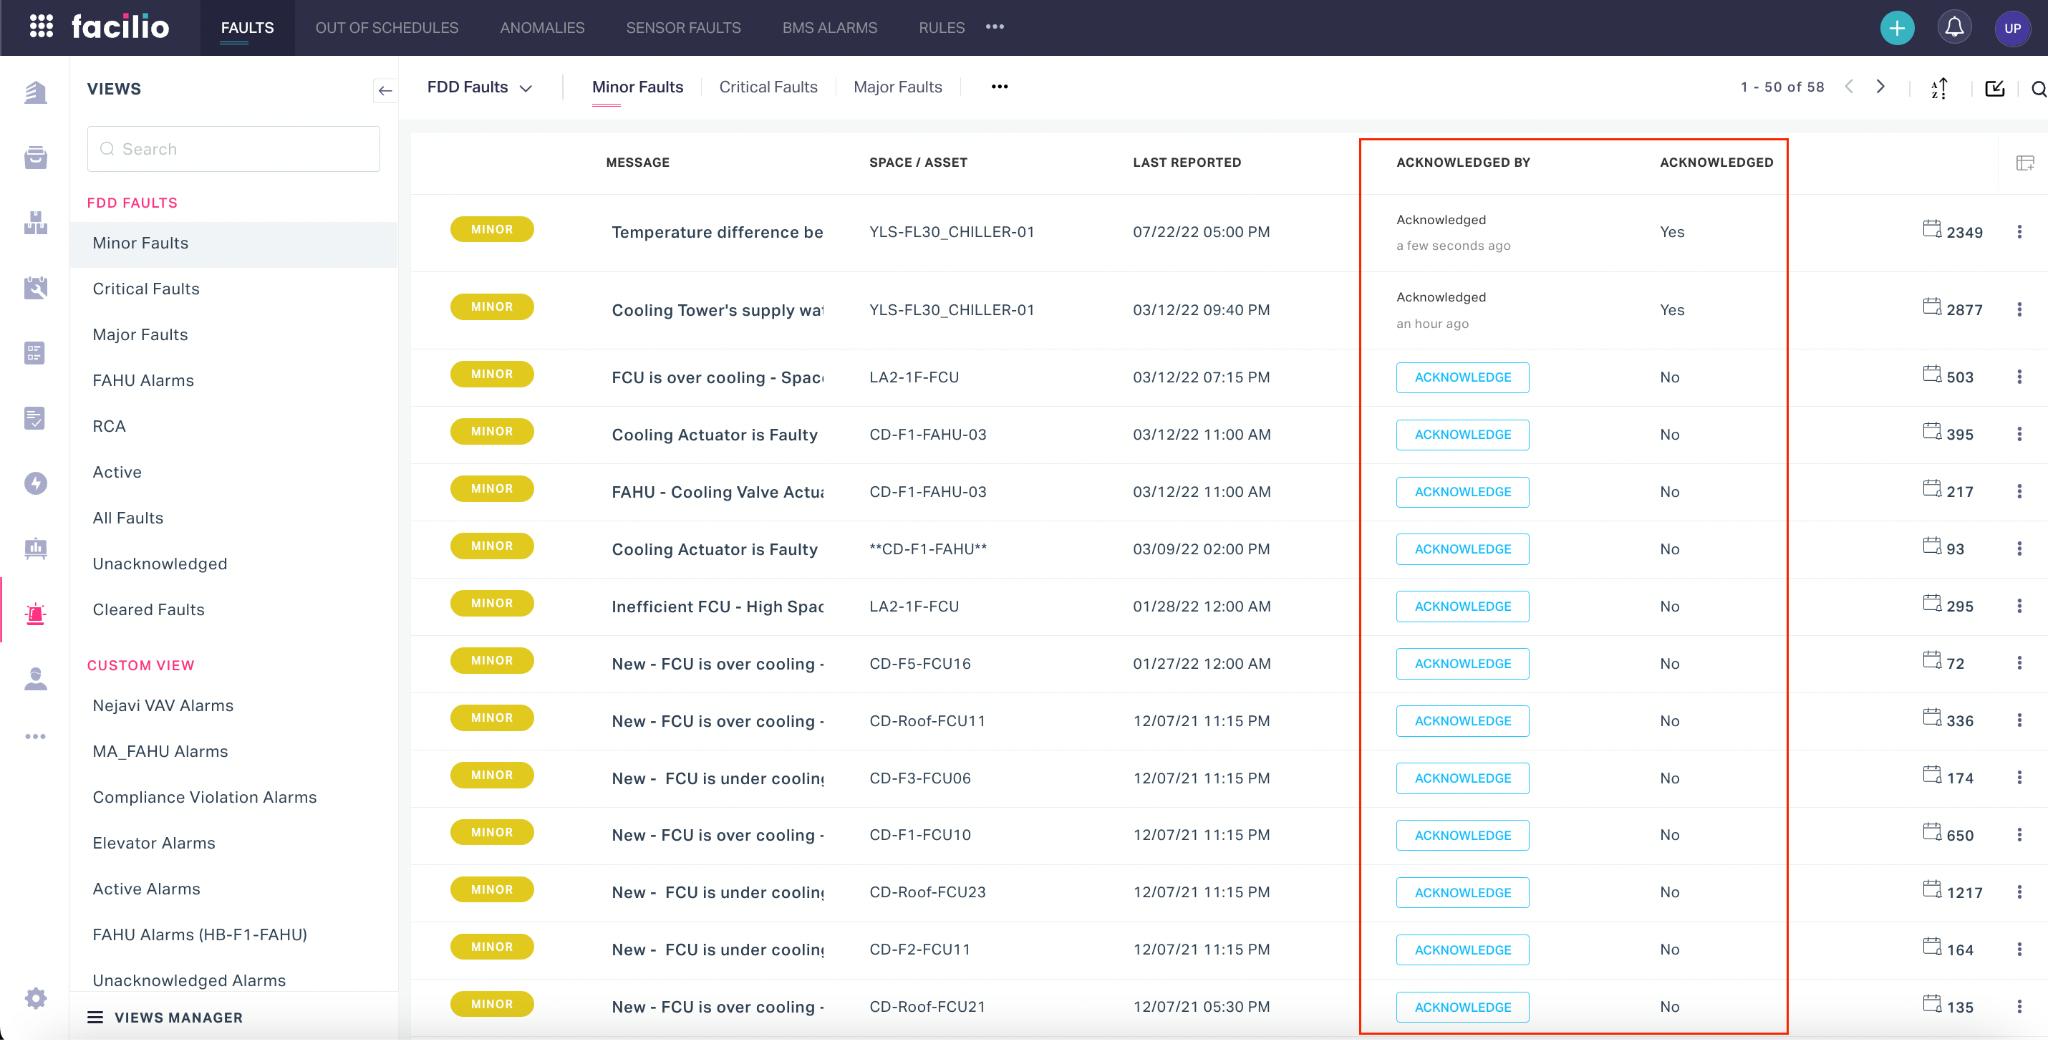
Note: When an alarm is acknowledged, the application temporarily pauses to trigger notifications on it.
Resolving Fault Alarms
You can resolve an alarm when the investigation is complete, and you have either fixed the issue or decided on further corrective measures. This section explains the possible actions taken over an alarm in the FAULT section.
Click on the ![]() (vertical ellipsis) icon corresponding to a record to explore the available action items.
(vertical ellipsis) icon corresponding to a record to explore the available action items.
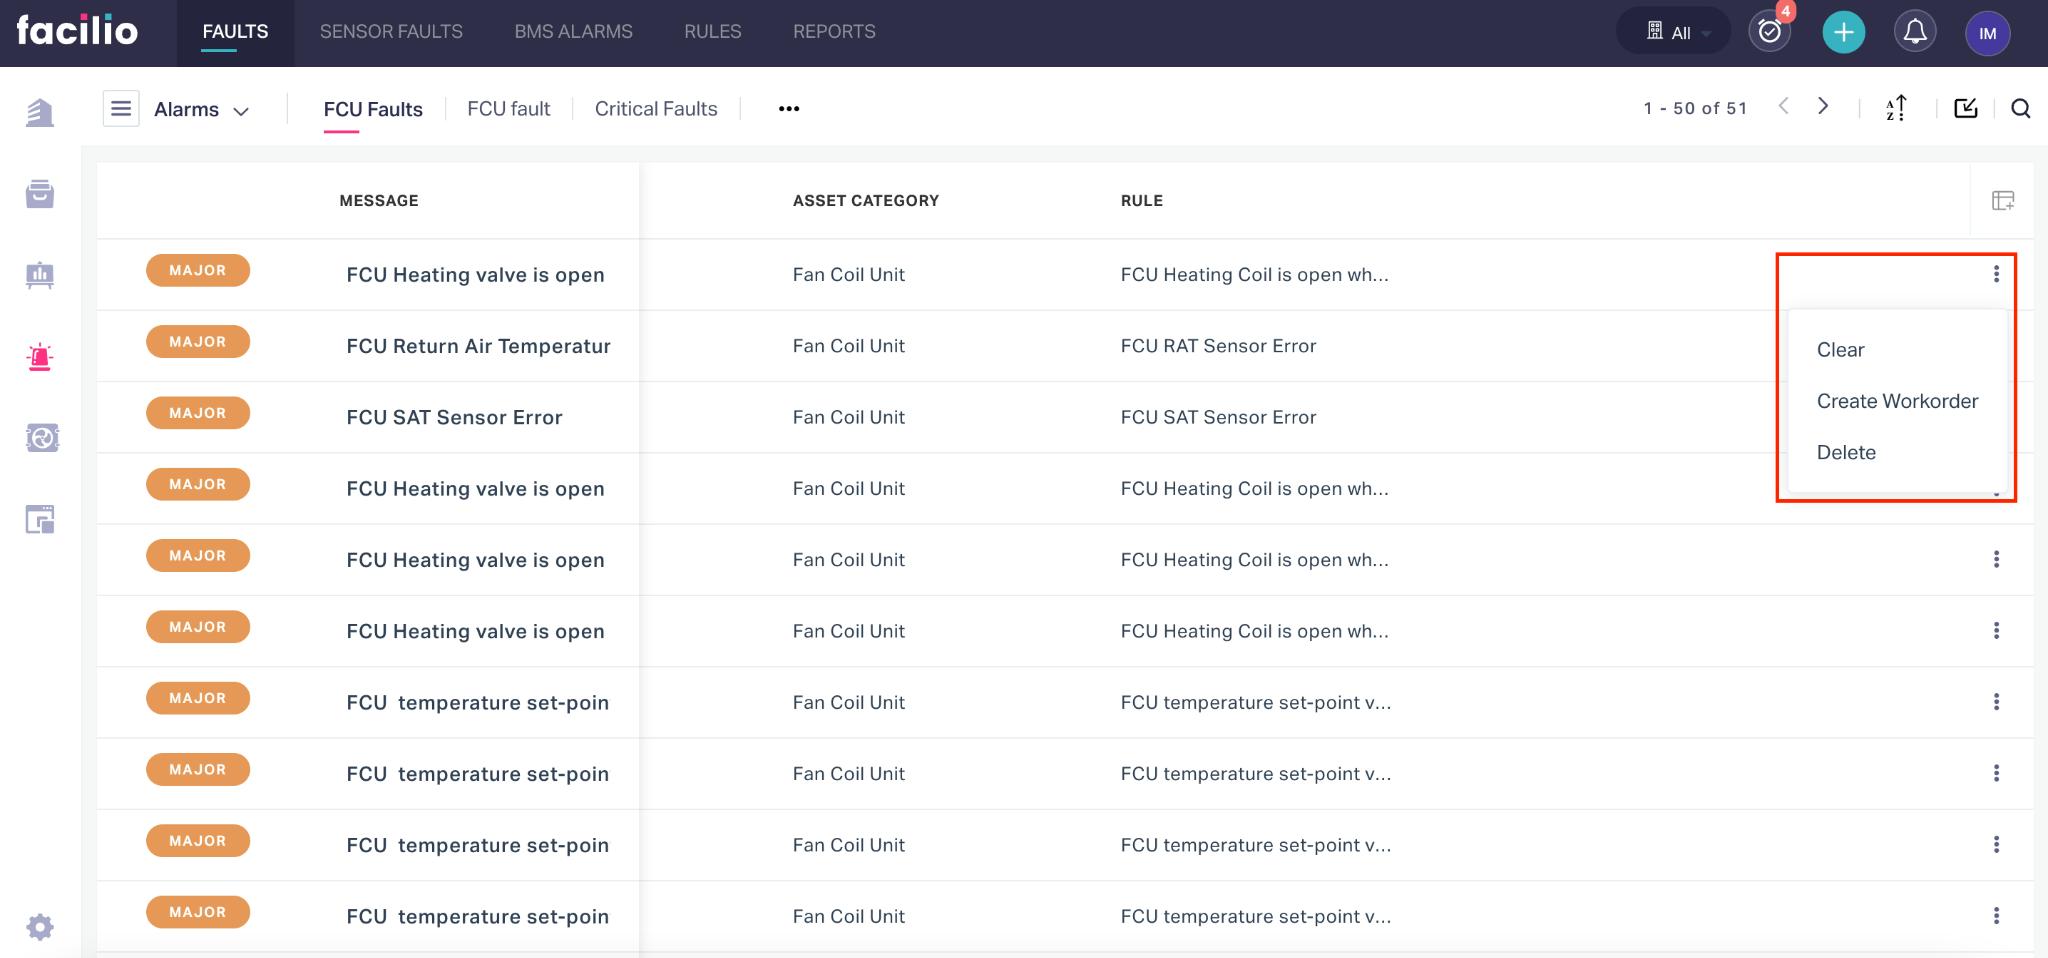
Based on the condition of the fault, you can prefer to choose among any of the following options:
Clear - To move an alarm from the list of active faults, as the cause of the alarm is addressed and the issue does not persist anymore
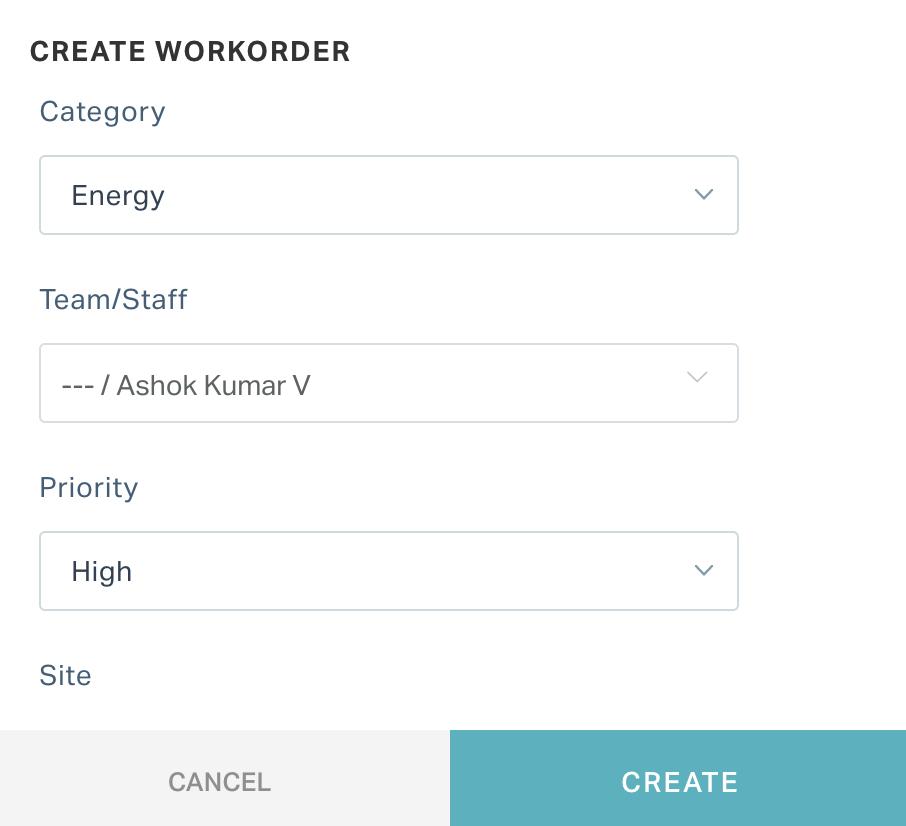
Create Workorder - To raise a ticket for assigning the issue to a specific maintenance team or personnel for resolution. Update the Category, Team/Staff, Priority, and Site fields in the CREATE WORKORDER window that appears and click Create , to complete the assignment.
Note: Once the concerned workorder is resolved, you can clear the alarm to move it out of the active faults list.
Delete - To remove an alarm permanently from the list of active faults, as the alarm is invalid.
Note: You can only delete the faults that do not need a clearance and are active for no apparent reason.
The facility manager further investigates the situation and takes necessary steps to clear the entries in these sections.
Managing Alarm Rules
An alarm rule is a set of conditions, configured for each asset/space in the facility, which when met, triggers an alarm. By configuring appropriate alarm rules you can diagnose and treat the inconsistencies in a facility more effectively. This section moves you through the process of creating and configuring and working with alarm rules.
Creating an Alarm Rule
The alarm rules evaluate every reading of the concerned asset or space to determine whether an event should incur an alarm. To create a new alarm rule,
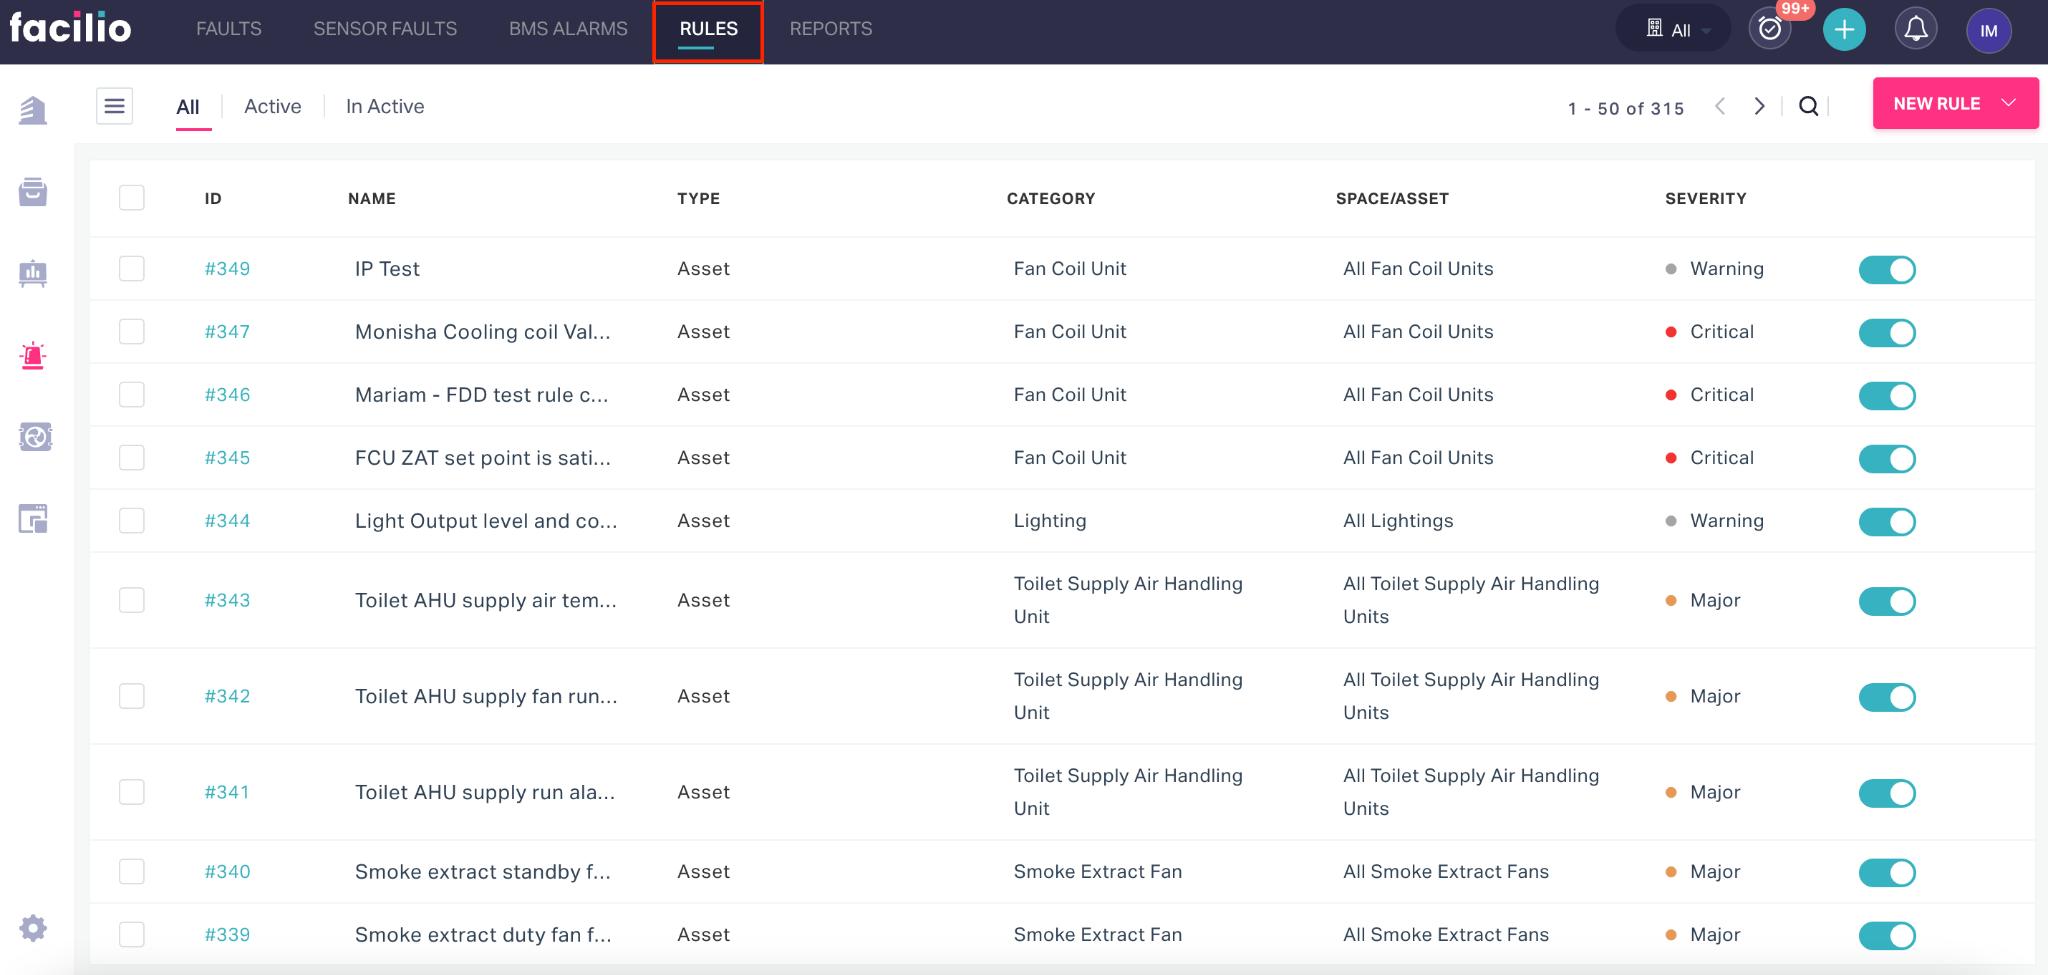
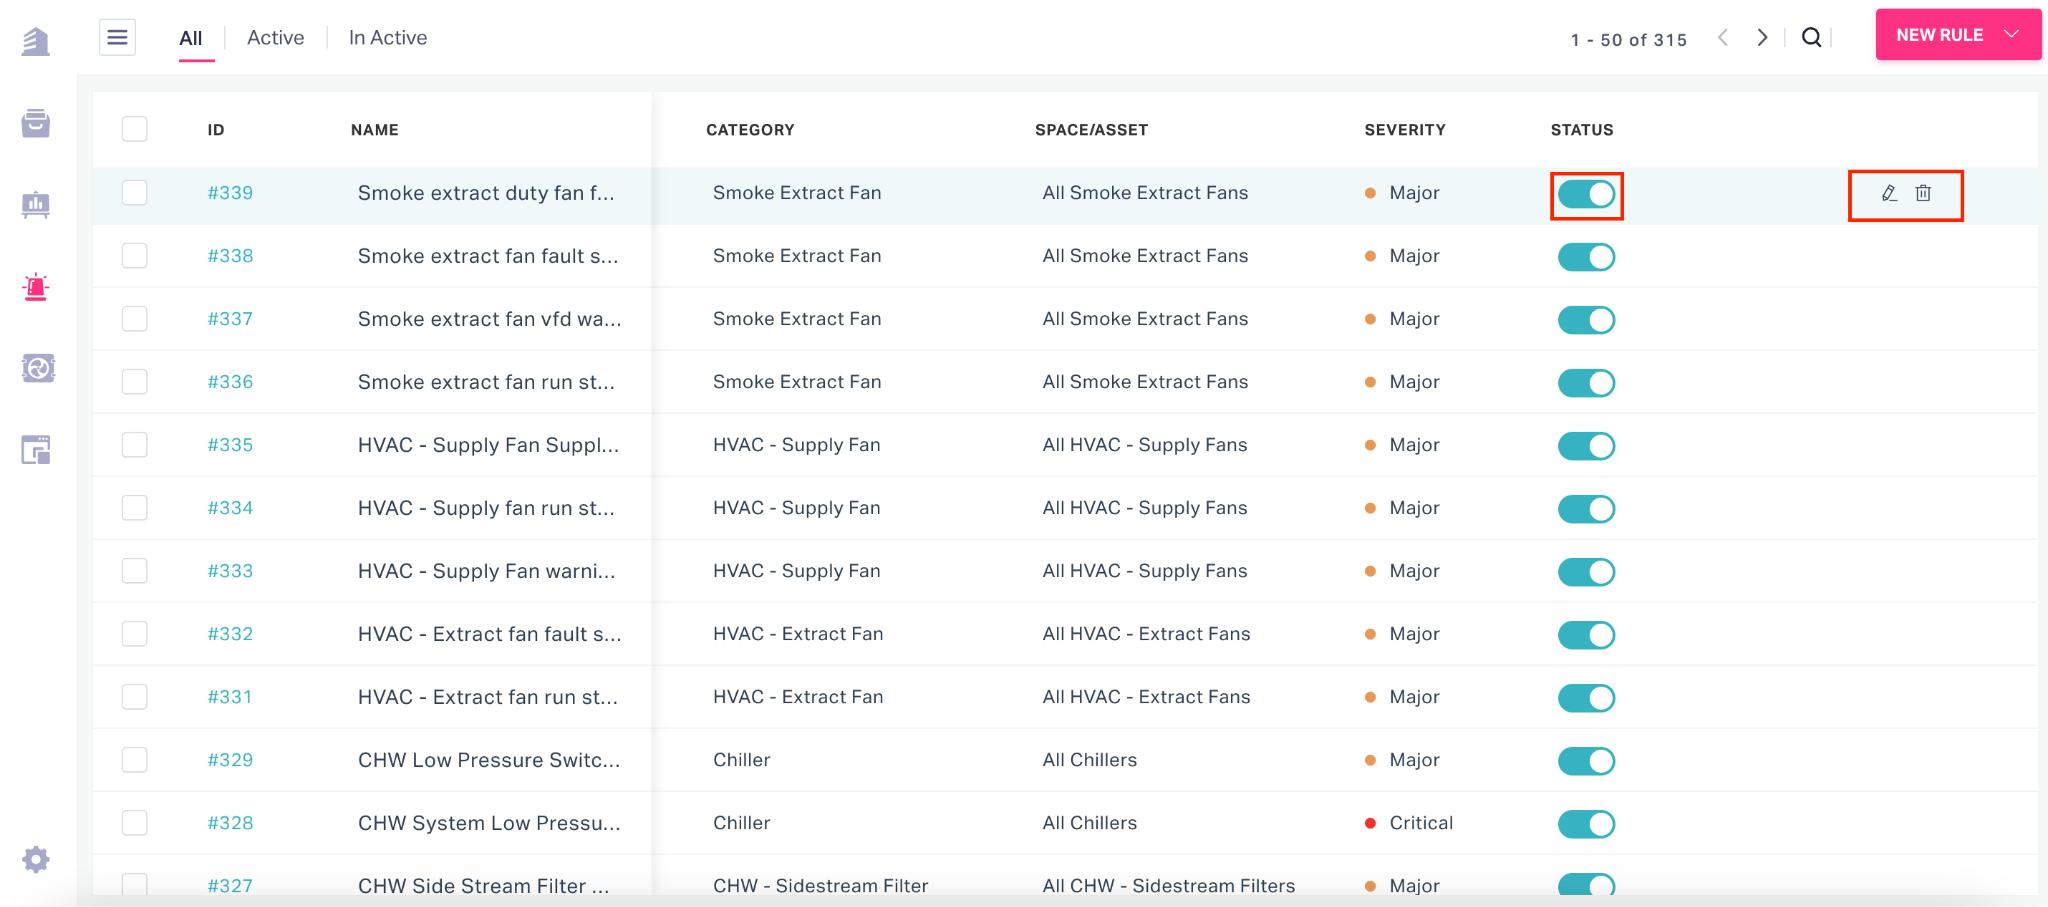
Navigate to the RULES section. All the existing rules are displayed by default as shown below.
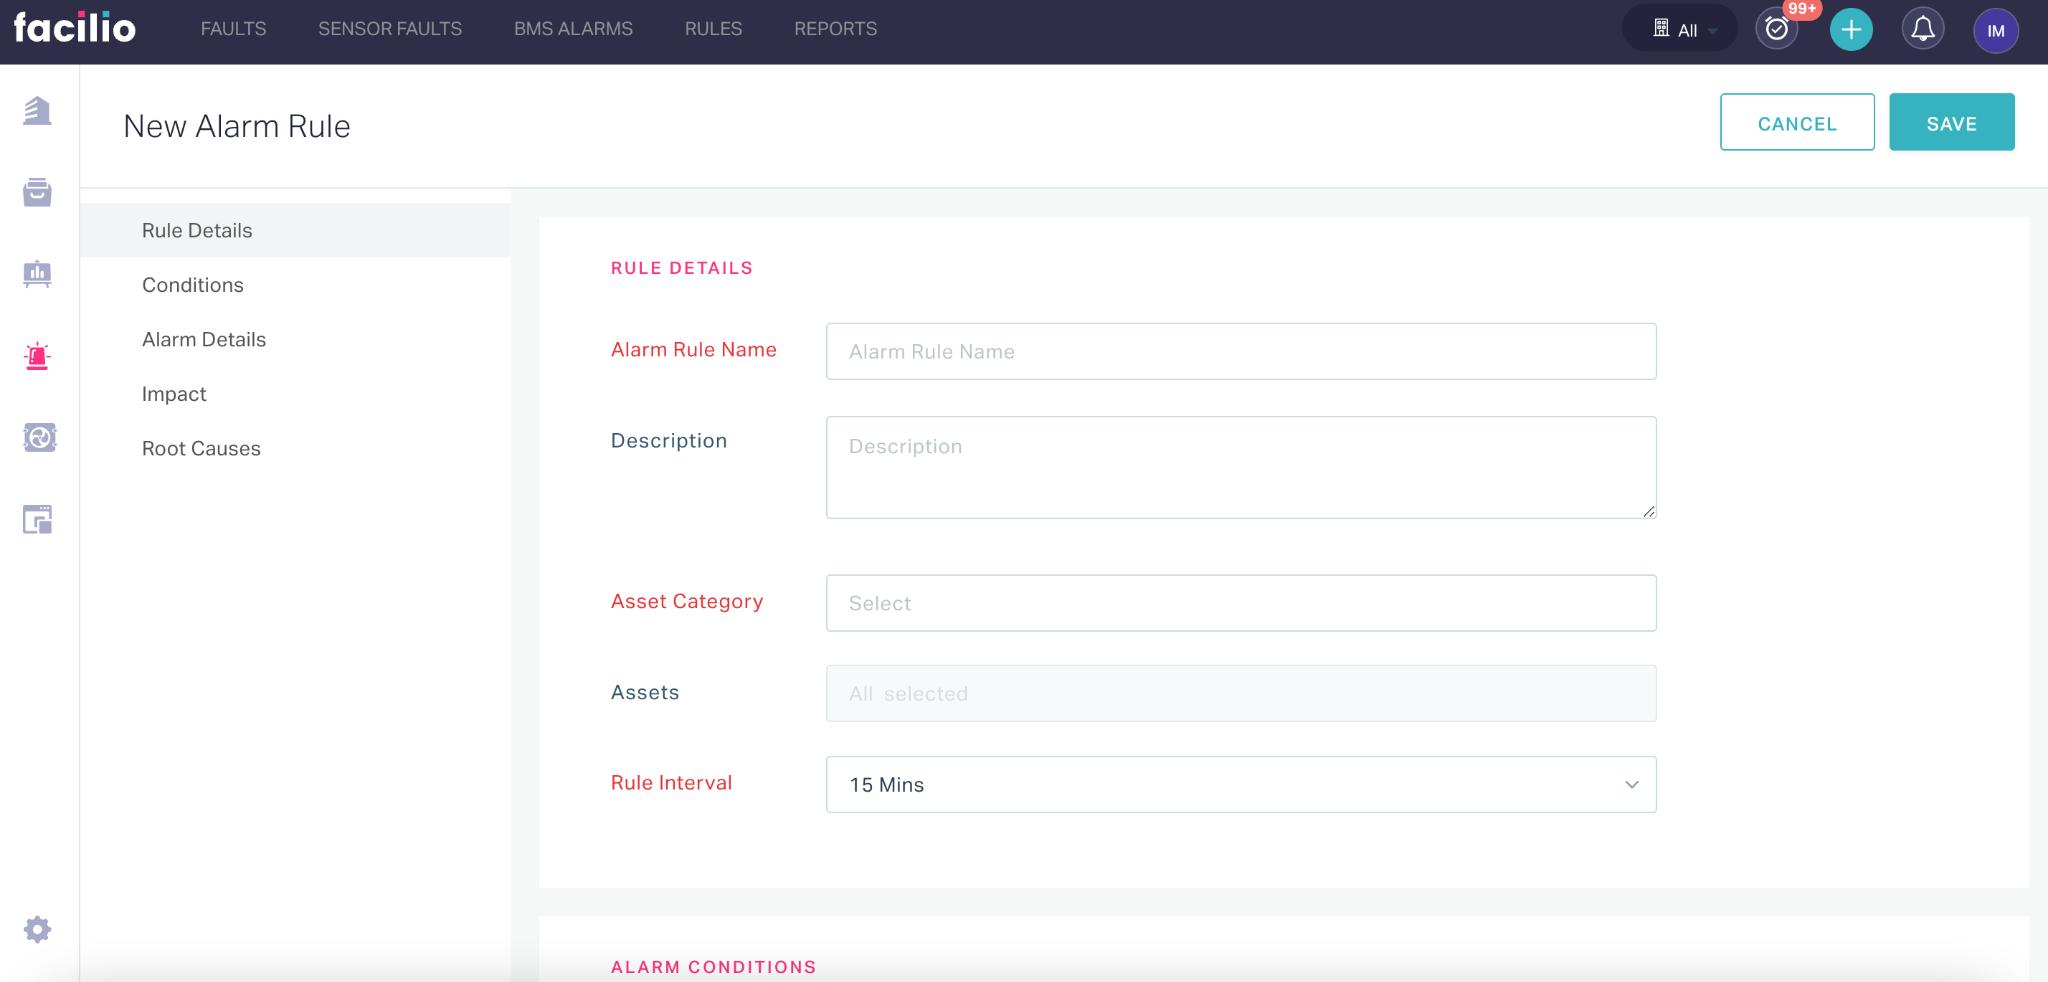
Click the NEW RULE at the top right and select New Alarm Rule. The New Alarm Rule screen appears.
Update the required fields in this screen. Read Configuring Alarm Rule Settings for more information.
Click SAVE. The created new alarm is now added to the alarm list.
Configuring Alarm Rule Settings
The specifications of an alarm varies based on the asset or space for which it is being created. The upcoming sections explain the configurations to be performed while creating an alarm rule.
Rule Details
The elementary requirement of creating a rule is to define the asset type to which it applies. In addition, this section allows you to register the details, like its name, purpose, alarm frequency, and so on.
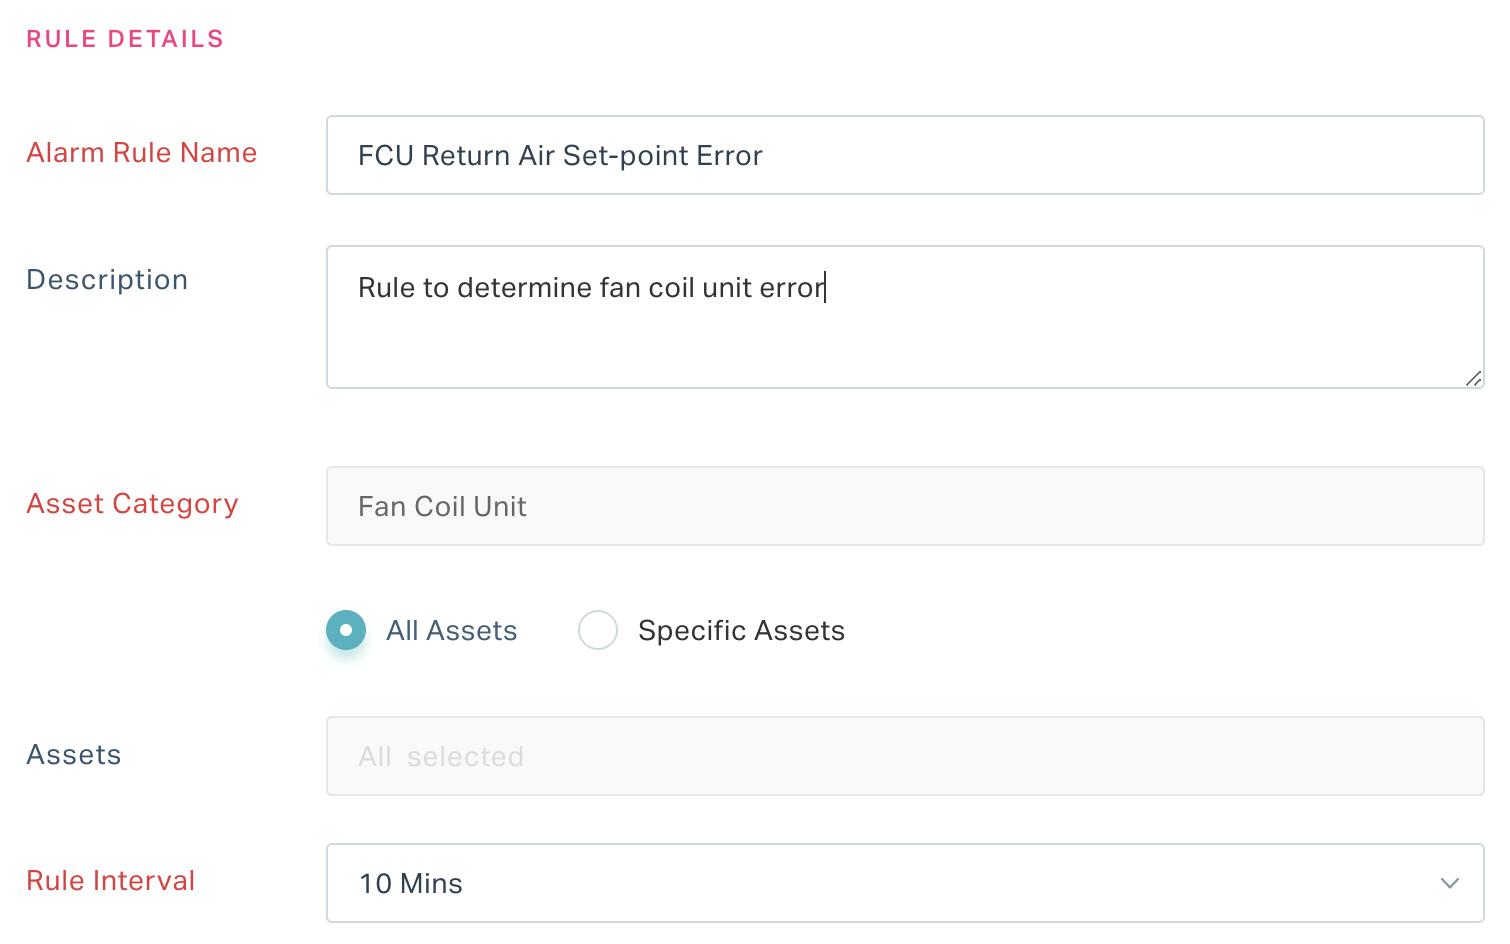
You can update the following fields in this section:
- Alarm Rule Name - A label to identify the rule
- Description - Ashort note describing the purpose of the rule
- Asset Category - The asset type for which the rule is being created
- Assets - The asset(s) for which the rule applies.Choose all assets or specific assets in that category by clicking All Assets or Specific Assets options, respectively.
- Rule Interval - Thefrequency to trigger the alarm when the specified conditions are met
Alarm Conditions
Alarm conditions are the criteria for triggering an alert. This section allows you to define the related groups and variables, and configure expressions that, when evaluated to true, will denote faults raising alarms.
Defining Related Group
Defining a related group involves grouping together specific variables or data points within a system based on predefined relationships. It allows for organized and structured representation of interconnected elements. Related groups are often used in configuring expressions, such as alarm rules, where a set of variables with specific relationships are collectively treated as a unit for more efficient and coherent data processing or analysis. Click the Add Related Group link to configure a related group.
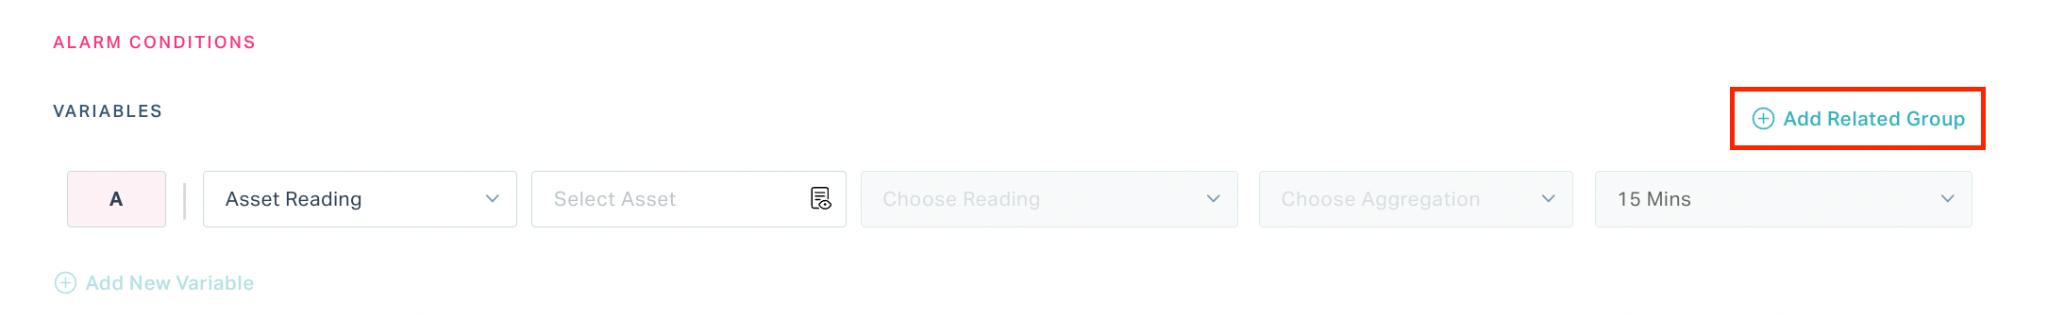
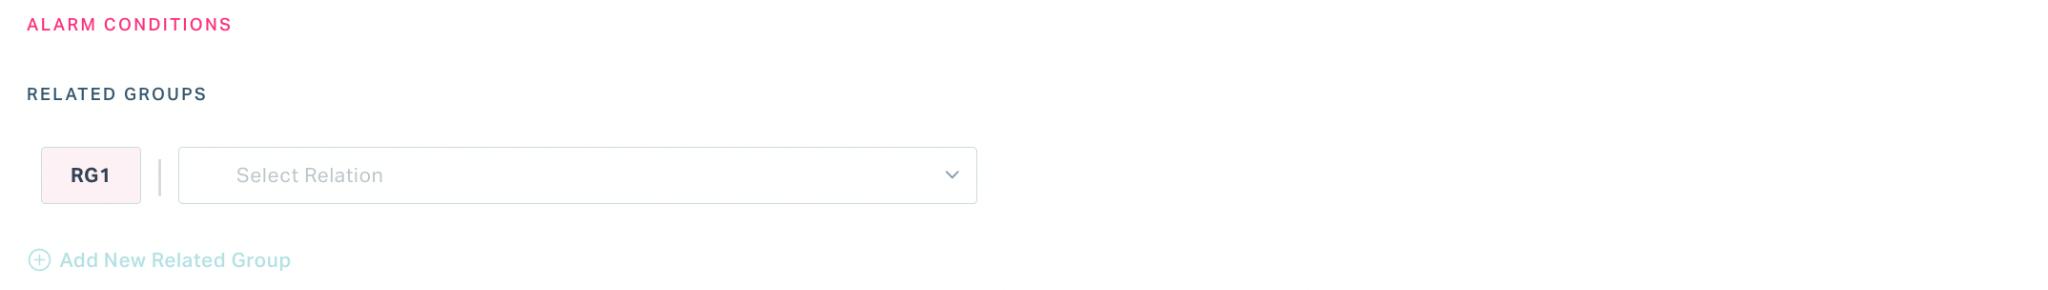
You can choose a relation from the dropdown menu to complete creating a related group.
In the case of choosing a ‘one to many’ or ‘many to many’ relationship you can define the aggregation method and condition(s) to further filter the resultant data.
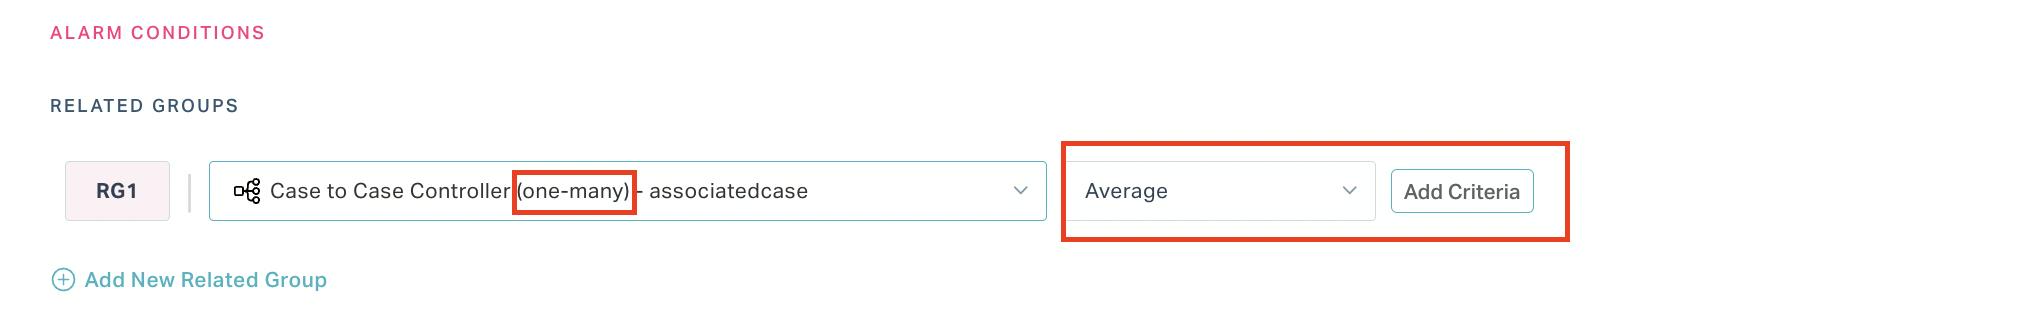
Note: The relationships(s) displayed in the dropdown are filtered based on the Asset Category selected.
You can configure more than one related group using the Add New Related Group link. The related groups added here must be defined as variables to be incorporated into an expression. Read the Defining Variable section for more information.
Defining Variable
Defining a variable involves assigning a symbolic representation to a specific data point or condition within the facility management system. This variable acts as a placeholder, representing values like sensor readings or equipment states. By incorporating these variables into an expression, facility managers can create dynamic and responsive alarm conditions tailored to specific aspects of the facility's operation or environment.
To define a variable, configure the following fields in correspondence with the variable:
- Variable Type - The classification of the variable whether it is an asset, space, or related reading
- Select Asset/space - The subselection of the variable type chosen. For example, if the Variable
Type was set to Asset, this field allows you to choose the asset whose readings must be monitored. If the same field was set to Related Reading, you can choose the related group to monitor the concerned metrics.
Note: The Related Reading option appears in the dropdown, only if you have any related groups created in this section. Also, it is important to note that the readings listed in the dropdown list are the ones related to the target module configured in the selected relationship. Read the Defining Related Group section for more information. - Choose Reading - The metric of the selected asset that is to be evaluated.
Note: A reading is displayed in the drop-down only if it has any data associated with it. - Choose Aggregation - The aggregate function to be applied over the specified reading
- Choose Time - The interval at which the aggregation must be performed
Note: You can use the ![]() (Add New Variable) link and the
(Add New Variable) link and the ![]() (Delete) icon to add and delete variables, respectively.
(Delete) icon to add and delete variables, respectively.
Configuring Expression
Configuring an expression involves setting up a specific mathematical or logical representation within a system or application. In the context of facility management, configuring expressions is often related to defining rules or conditions for alarms, analytics, or calculations. This process includes specifying variables, operators, and constants to create a formula or logic that determines how data is evaluated or processed within the system, allowing for customized and dynamic responses to various conditions or events.
To configure an expression, enter the required formula that includes the defined variables as shown below.
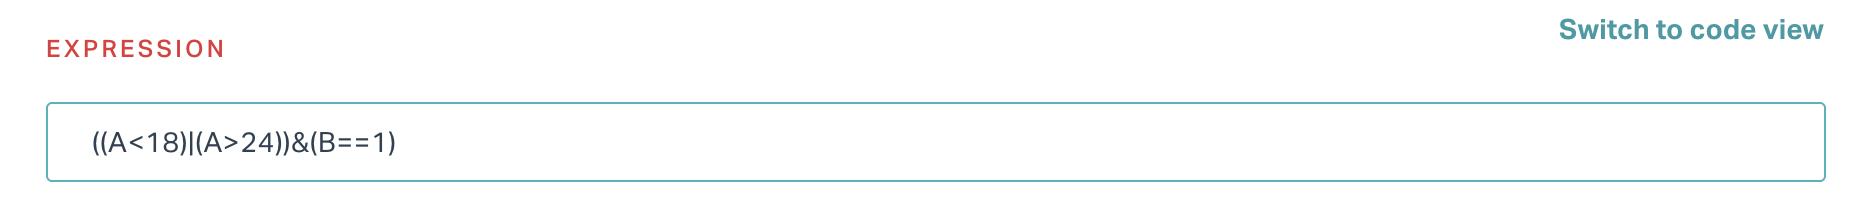
Note: You can use the switch to code view link to modify the defined expression or configure the expression through script
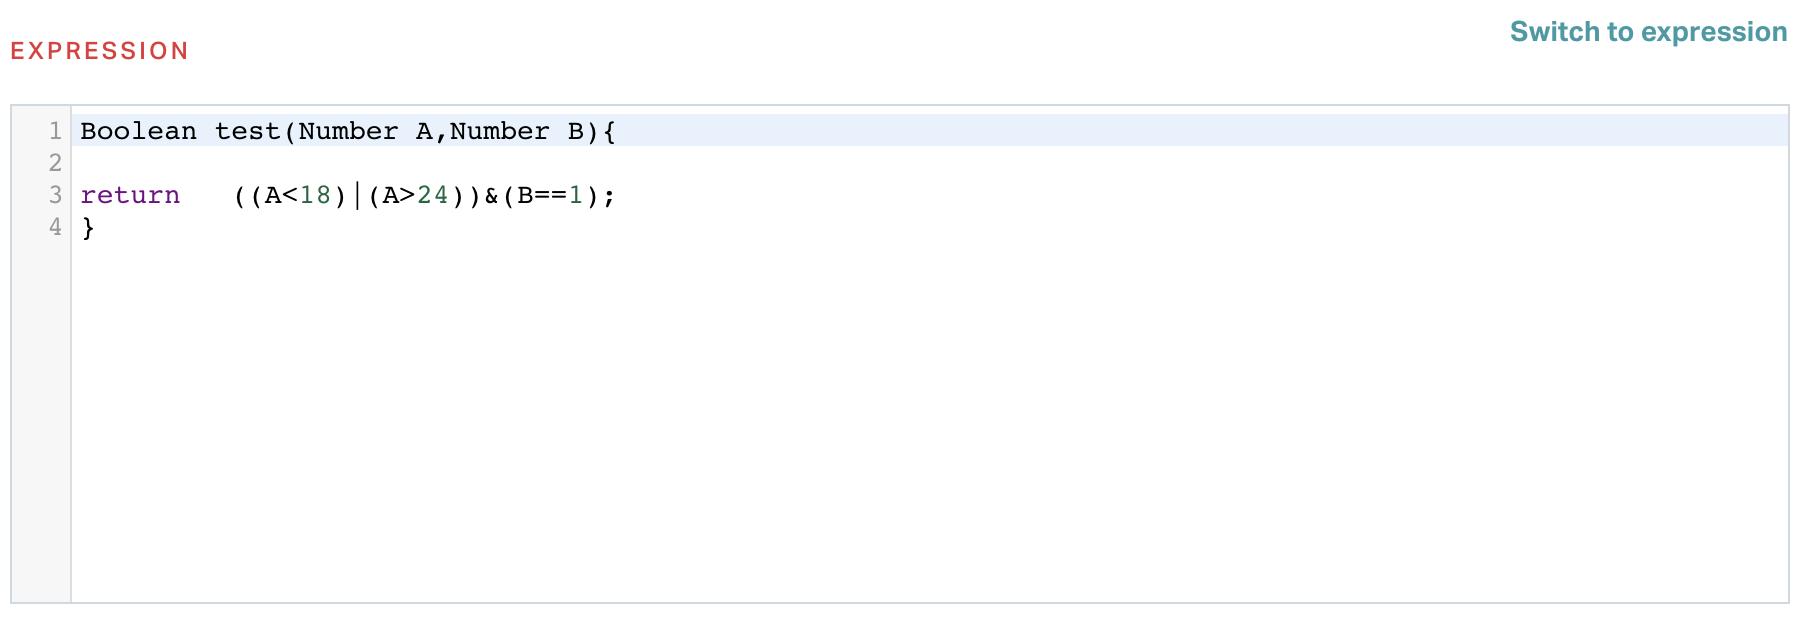
You can exit the code view anytime using the Switch to expression link.
Alarm Details
An alarm is not a mere indication of a fault. More than a notification, it helps the concerned personnel understand the criticality of the issue and offers suggestions to resolve it. This section allows you to specify the details to be displayed at the instance of the alarm.
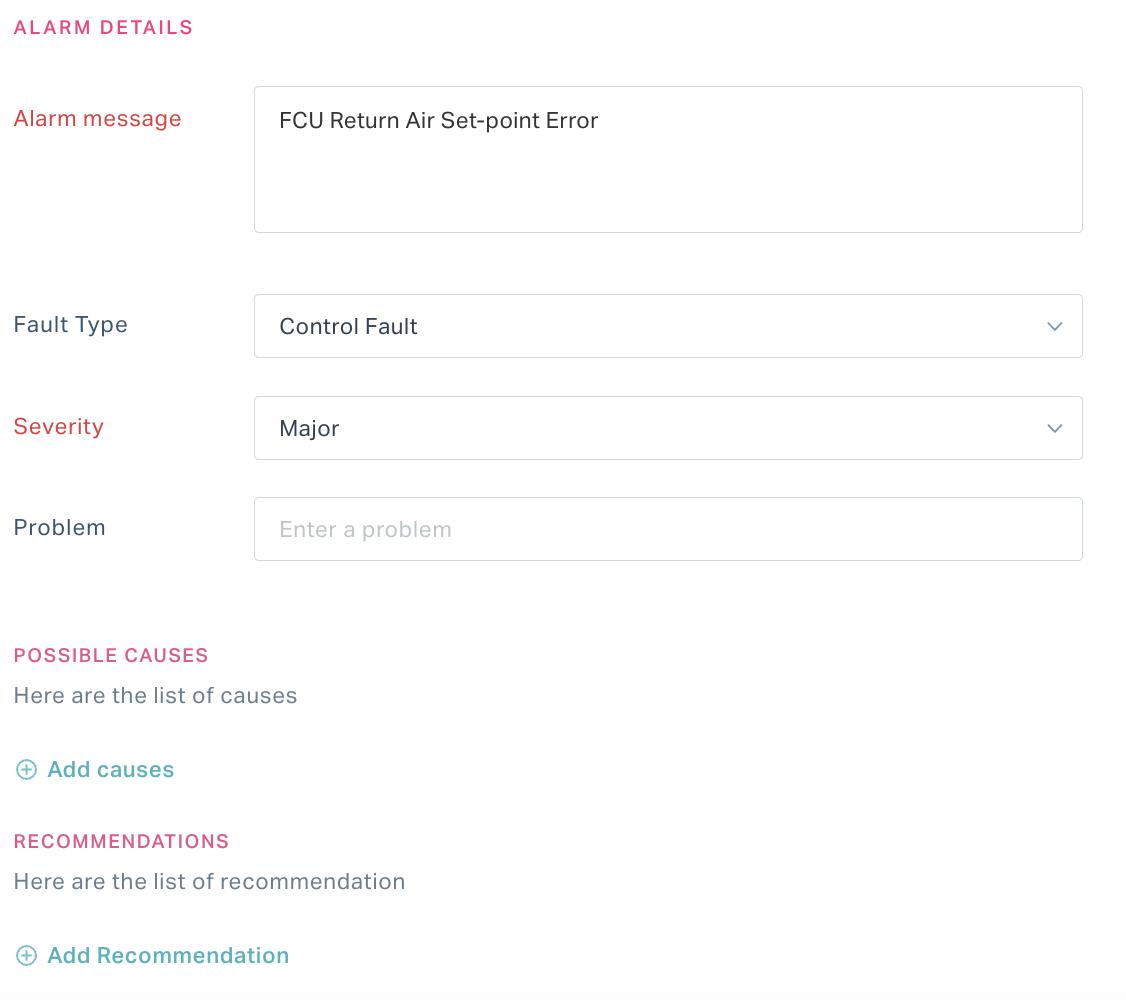
You can update the below fields in this section.
- Alarm Message - A short text to be sent to the recipient regarding the fault
- Fault Type - The categorization of the fault based on the nature of the incidence, such as operational fault, control fault, and so on
- Severity - The classification of the fault based on the level of impact and urgency to close, such as major, minor, critical, and so on
- Problem - The actual issue that has triggered the alarm
- Possible Causes - The possible reasons for occurrence of the fault
- Recommendations - The suggestions for eliminating or reducing the occurrence of the fault in future
Note: You can add multiple causes and recommendations using the Add Causes and Add Recommendation links, respectively.
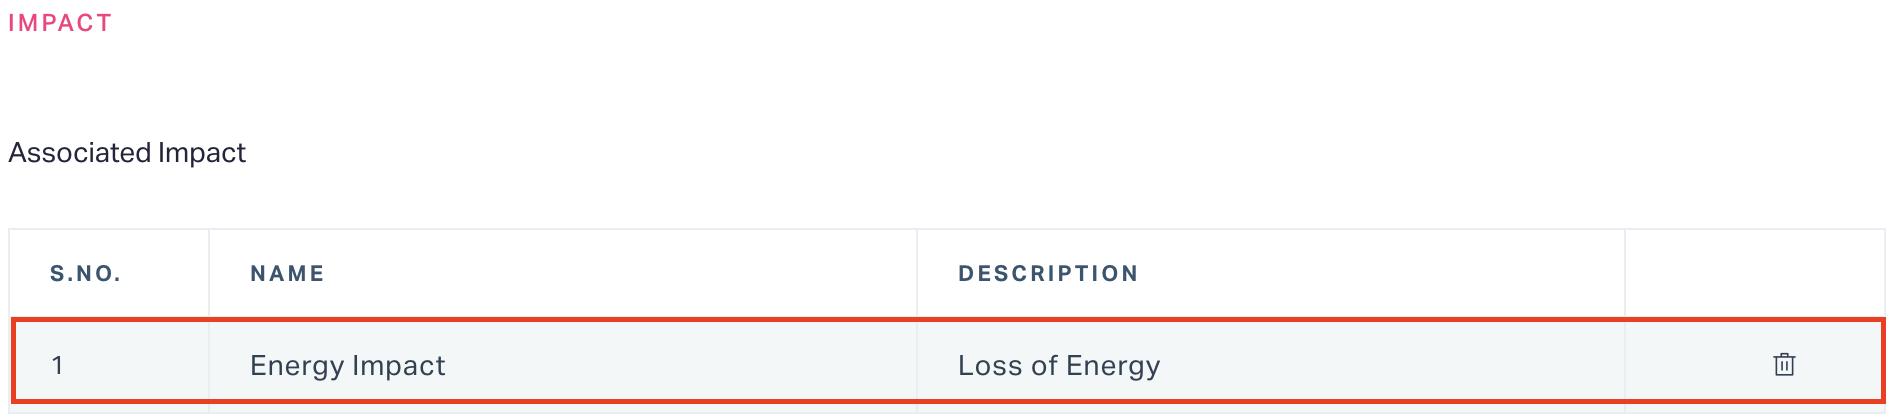
Impact
The impact is the effect of a fault that might incur additional costs or lead to excessive utilization of resources. This section allows you to associate the possible impacts that helps to understand the severity of the fault. You can use the ADD IMPACT linkto add the possible impact(s) and click SAVE.
Root Causes
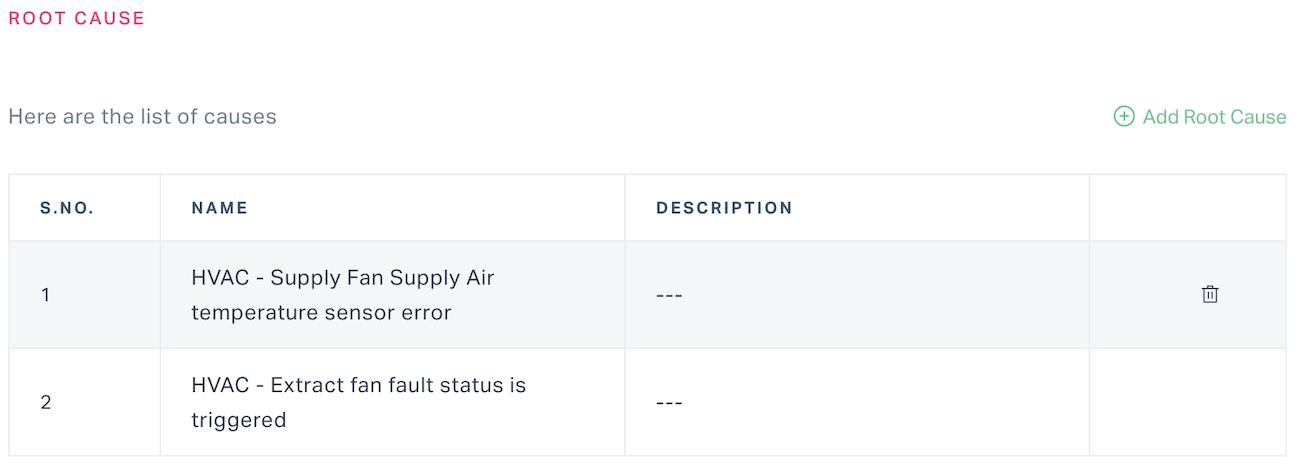
The root cause is the reason which explains why the alarm was triggered. More precisely, it is the source of the anomaly for an integrated system in real-time. The purpose of defining the root cause for an issue is that it helps to derive the appropriate corrective measures and prevents the event from repeating. You can use the Add Root Cause button to associate a root cause in relation to the fault.
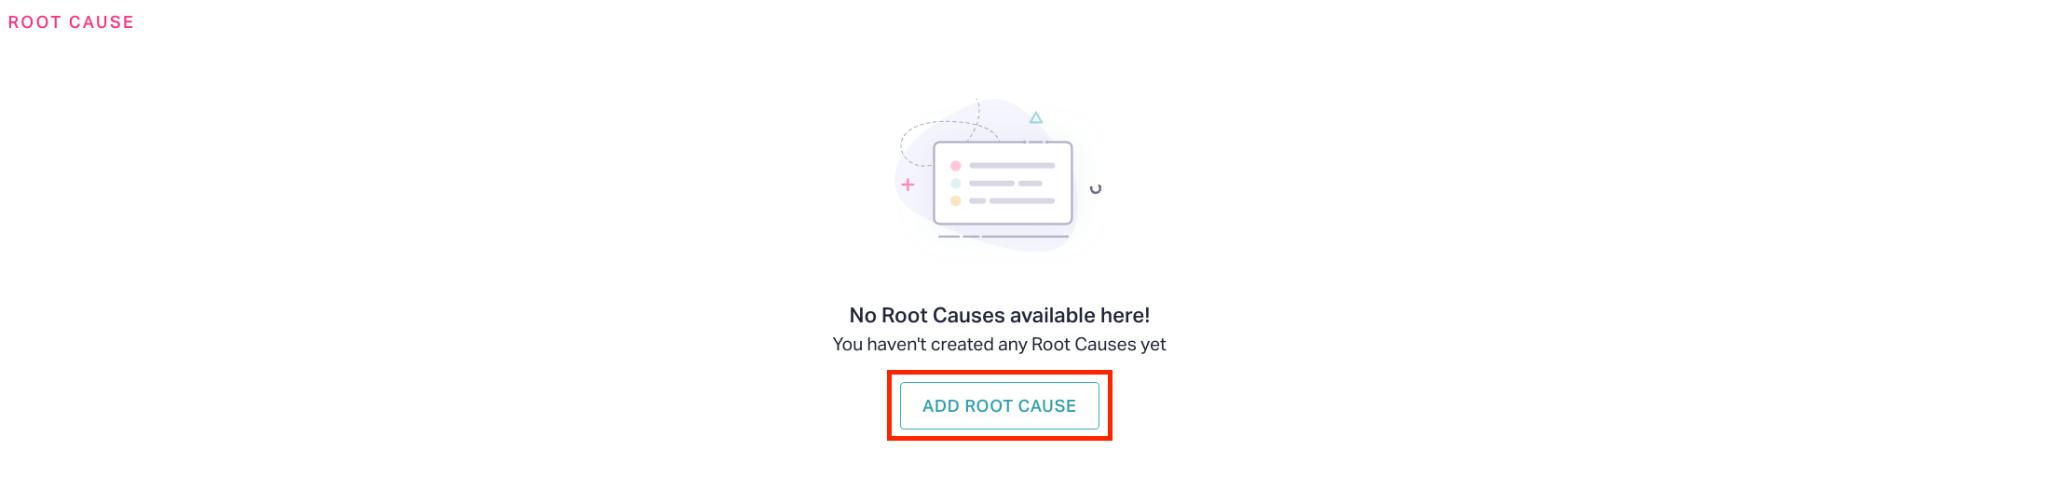
Note: You can associate multiple root causes to an alarm rule. Also, you can use the ![]() (Delete) icon to remove any irrelevant root cause.
(Delete) icon to remove any irrelevant root cause.
Viewing Alarm Rule
You can view the various attributes of the configured alarm rule by clicking on the respective rule name. Upon clicking the rule name, the SUMMARY screen appears by default as shown below.
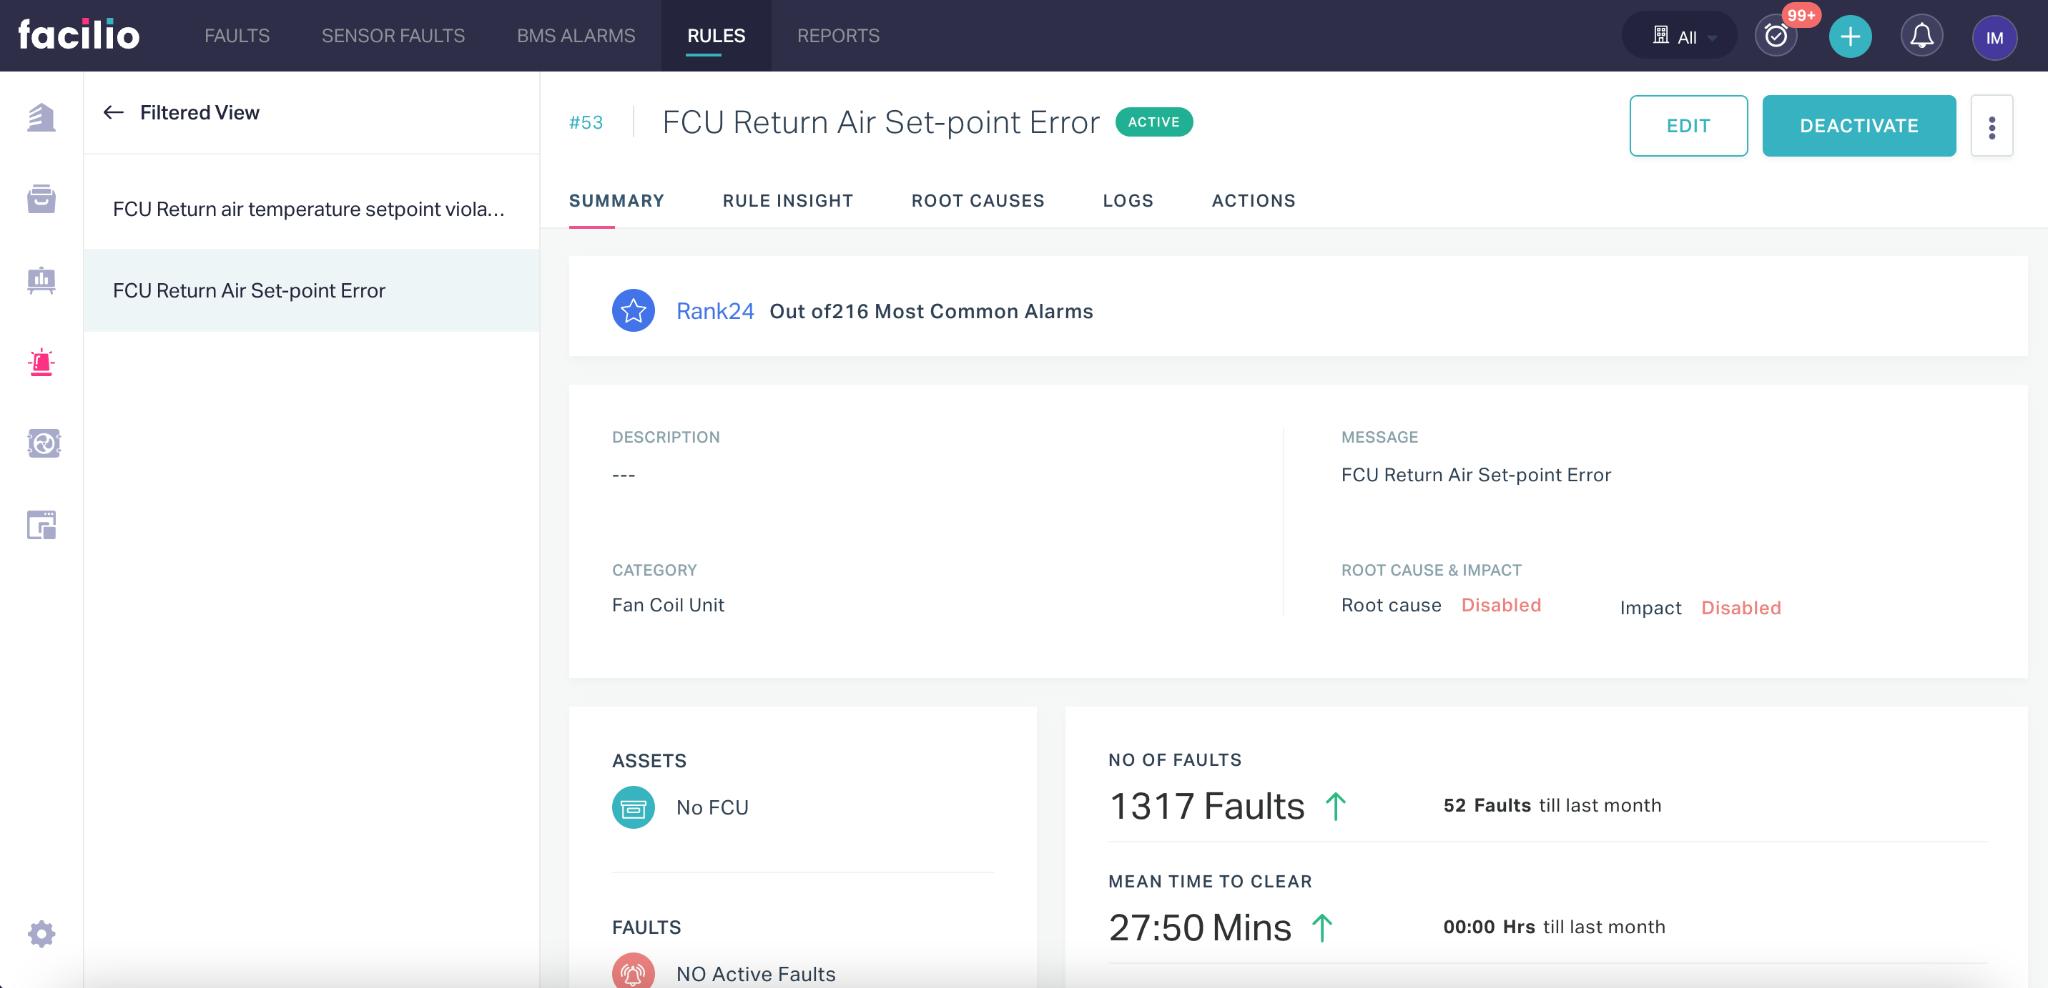
Summary
The SUMMARY section displays the alarm rank, basic alarm details, fault information, associated work orders, and other related information. The alarm rank is given based on the number of occurrences out of the most common faults.
Rule Insight
The RULE INSIGHTsection provides the list of assets to which the rule is associated and their respective fault reports. The fault report of an asset depicts the number of occurrences of the fault, duration for which the issue prevails, and graphical representation of fault insights.
Note: You can use the date picker ( ) to choose a time range to filter the displayed data.
Root Causes
The Root Causes section displays the possible reason(s) for the occurrence of the fault.
Logs
The LOGS section displays the number of alarms triggered based on the selected rule. You can use the Run Historical calculation link to view the alarms corresponding to the selected asset or space for a particular time period.
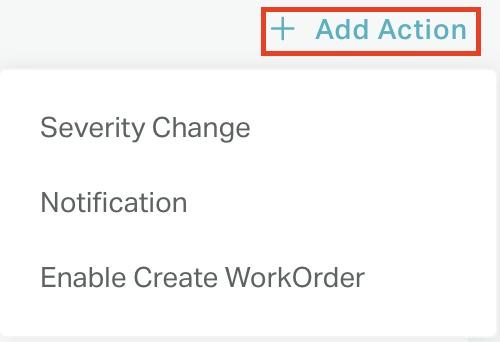
Actions
The ACTIONS section allows you to change the alarm severity, send notification on the fault to the concerned maintenance team or personnel, and configure automatic work order generation and closure. You can use the Add Action link to configure the required settings.
Note: You can use the EDIT and DEACTIVATE buttons at the top right of the alarm details screen to edit and temporarily disable the alarm rule, respectively.
Other Functionalities
There are certain functionalities and icons associated with this section to perform various other actions.
They are,
| Icon | Action/Description |
|---|---|
| To modify the details associated with the alarm rule | |
| To delete the alarm rule permanently from the list Note: It is recommended to deactivate the alarm rule so that it can be activated later, if required. | |
| To activate or deactivate the alarm rule |
Benefits of Diagnostics
The FDD (Fault Detection and Diagnostics) offers a range of benefits to building operations. The FDD interface interacts with facilities workflows to automate real-time solutions for anomalies in building performance. This module helps you cut across all barriers in asset management and sustain performance across the facility. You can obtain immediate response to disruptions and gain extensive intelligence on asset health, leading to potential energy savings across buildings. FDD quantifies impact and root cause of each fault and prioritizes which fault needs to be addressed first.