Viewing Flagged Alarms
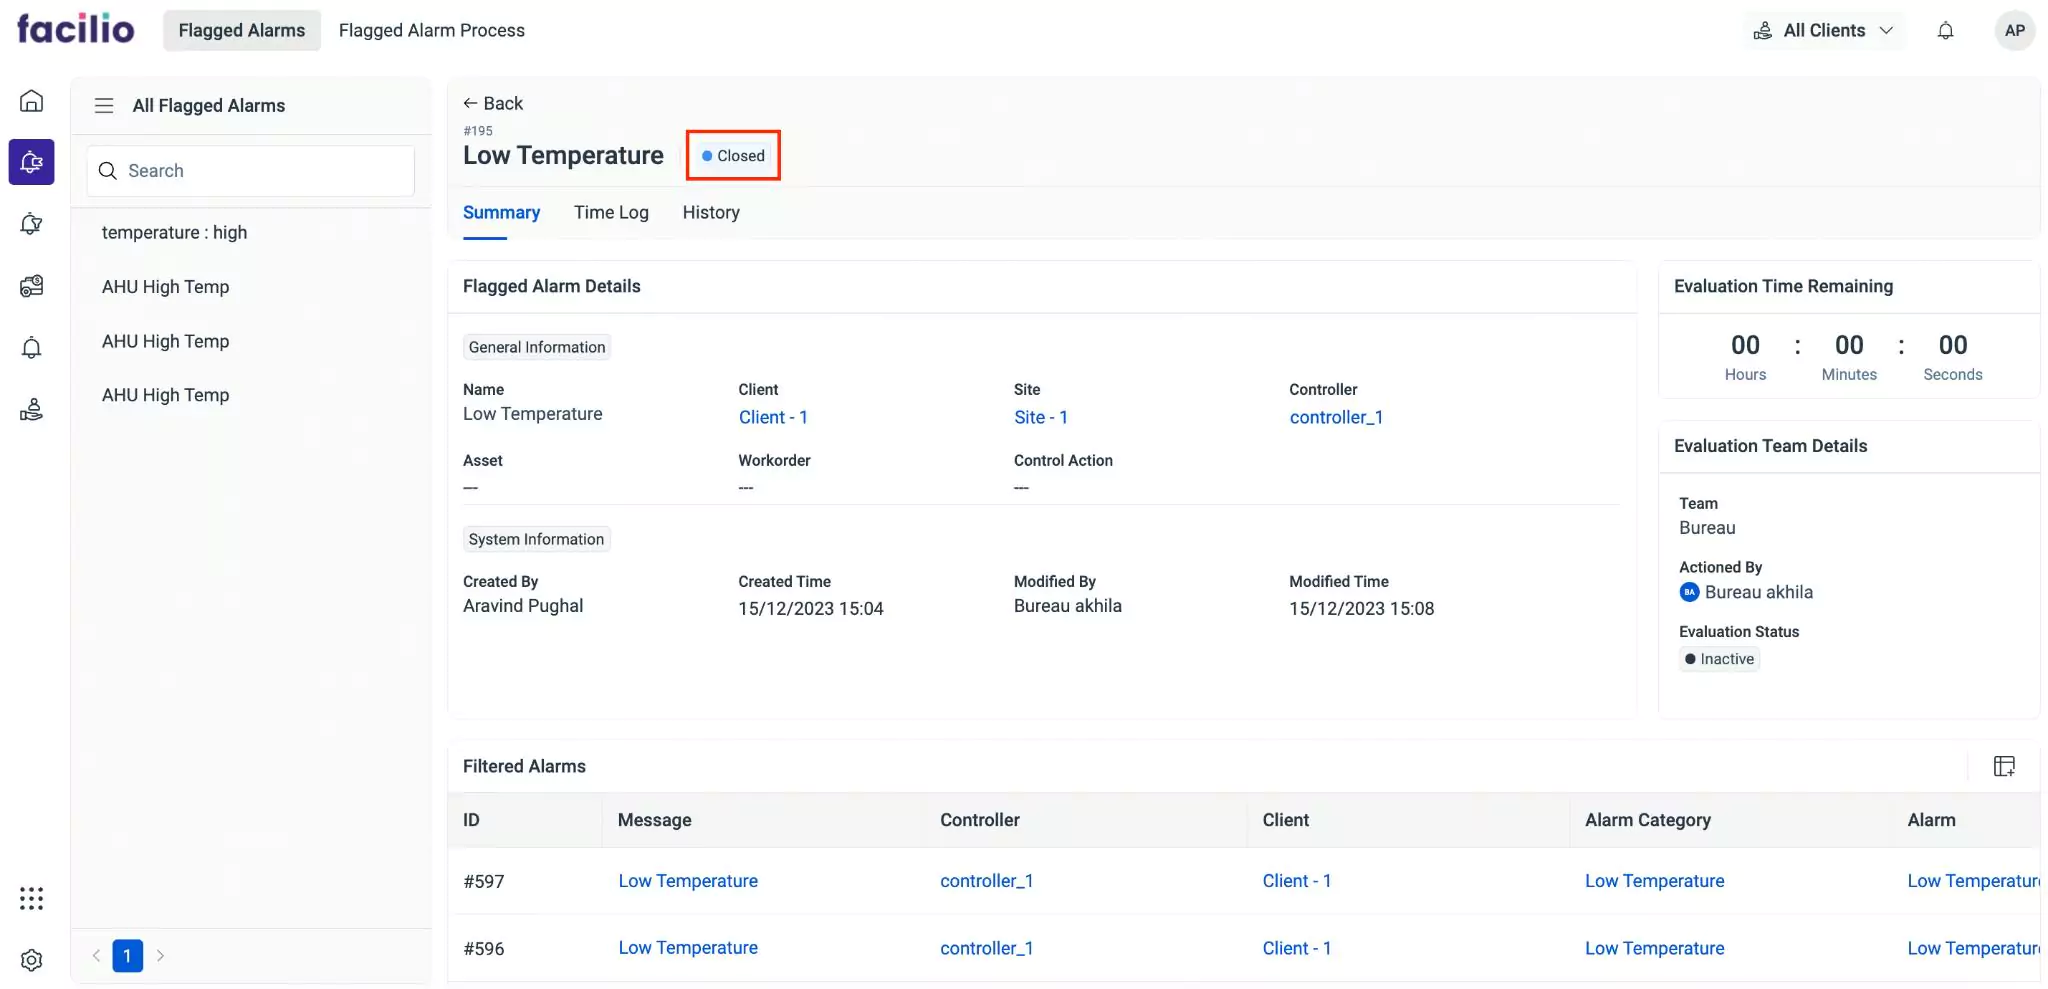
You can view the details of flagged alarms by clicking on the preferred record. The status of the selected record on top of the screen is updated based on the configuration done in the Configuring Actions section and the actions performed by the evaluation team(s). The following are the list of statuses.
- Open
- Closed
- Auto-Closed
- Workorder Created
The information in the details screen is grouped into Summary, Time Log, and History sections for better clarity.
Summary
The summary section displays the basic configuration details. The details include name, site, client, controller, asset, work order, assigned team and people, the user responsible for creation or modification, creation or modification date and time, remaining evaluation time, name of the evaluation team, evaluation status, the user responsible for the action taken, the associated filtered alarms, view details of the filtered alarm by clicking on the record, and details of the flagged events.
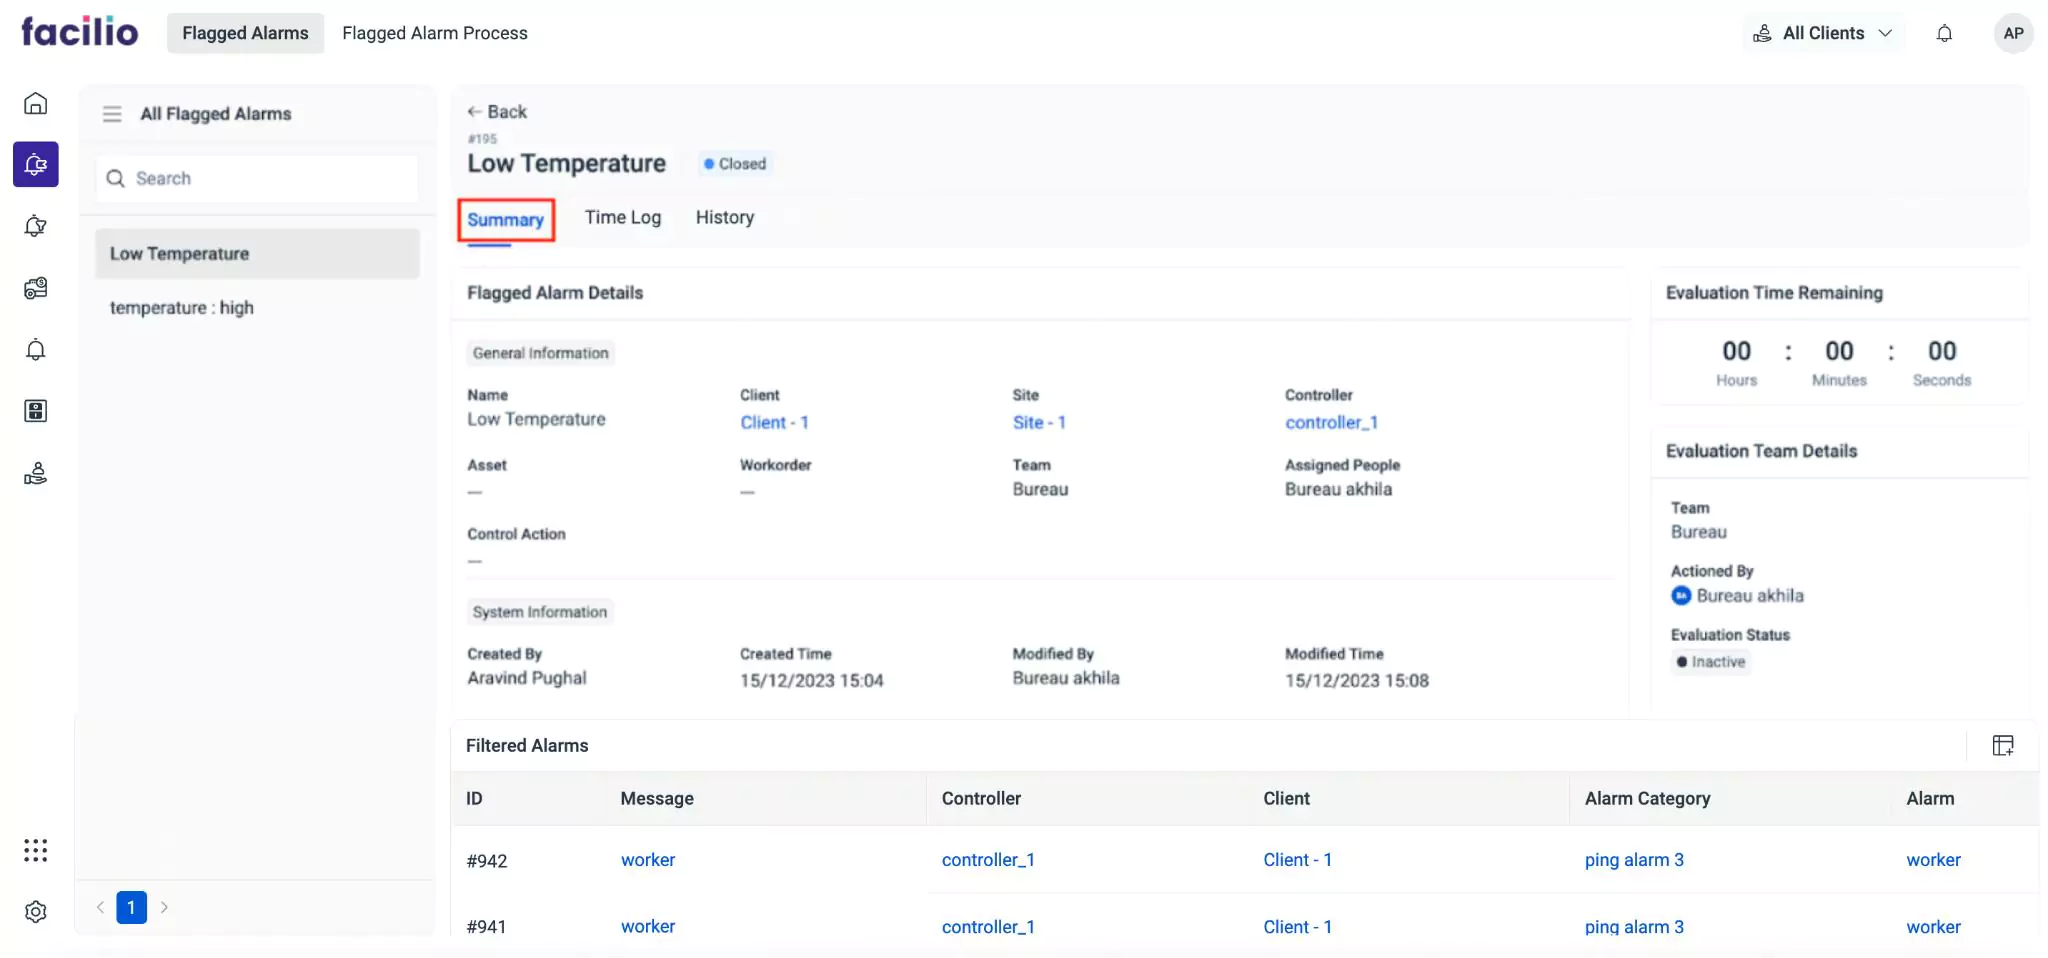
You can also add Notes, Comments, and attach relevant Documents to include additional information.
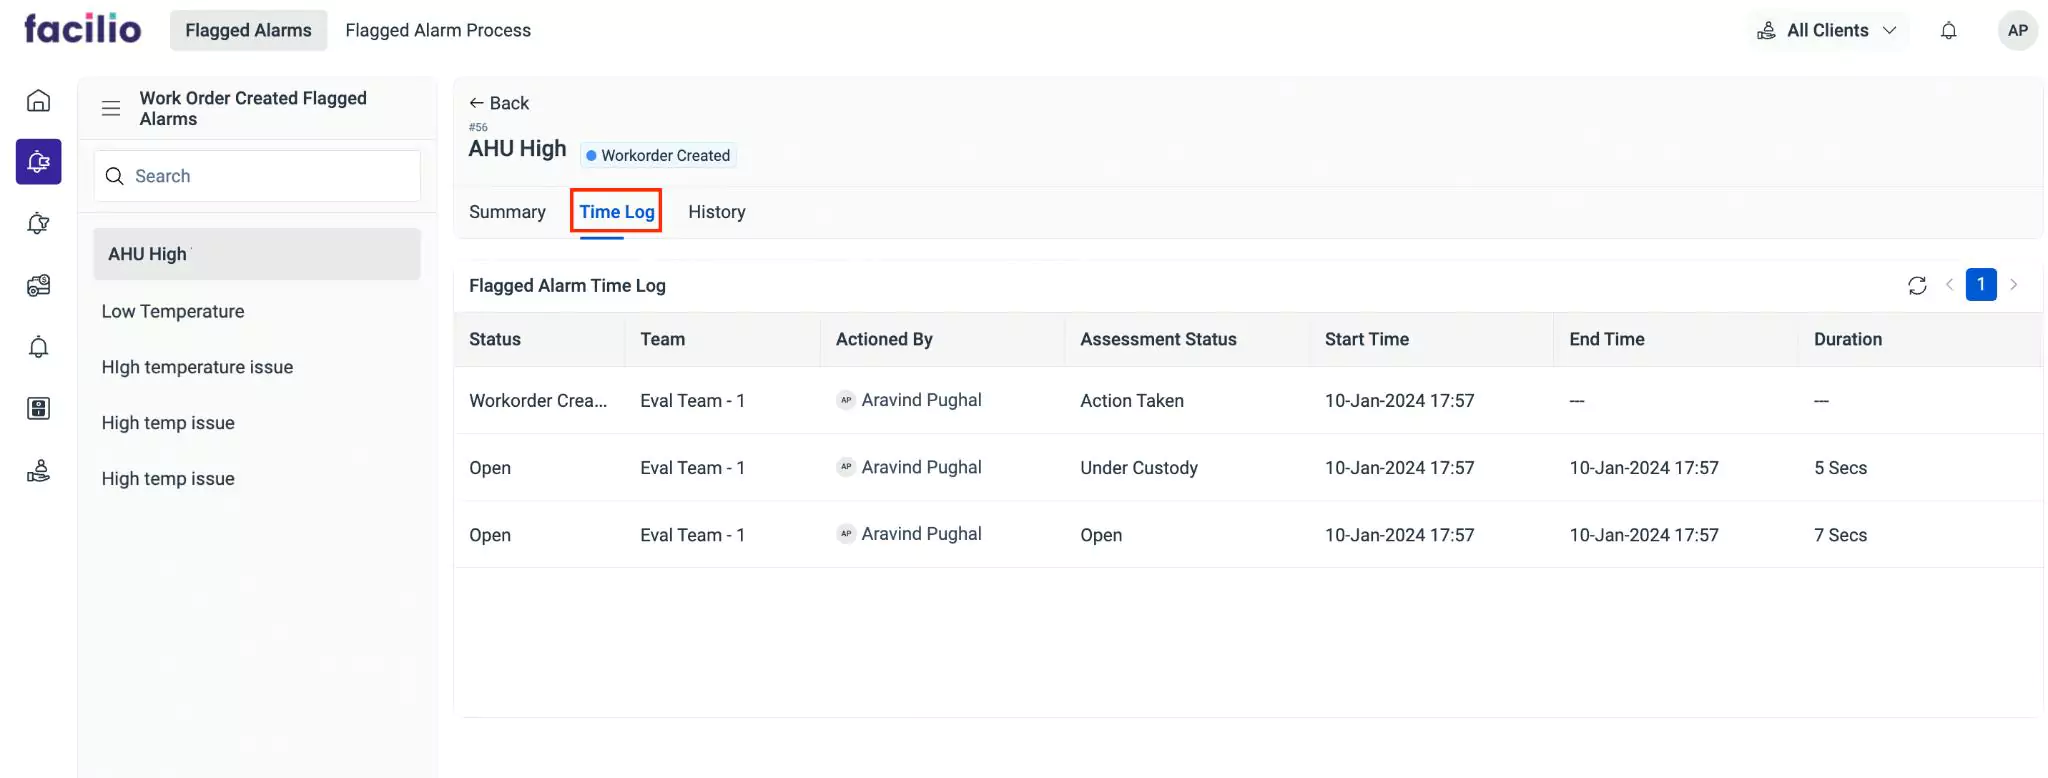
Time Log
The Time Log section displays details of significant activities associated with the flagged alarm. This log contains information like changes in the alarm status, assessment status, the designated evaluation team, the user handling the flagged alarm, initiation and conclusion timings of evaluation, and the total duration taken for the entire evaluation process.
You can click the ![]() icon to refresh and reload the latest logs.
icon to refresh and reload the latest logs.
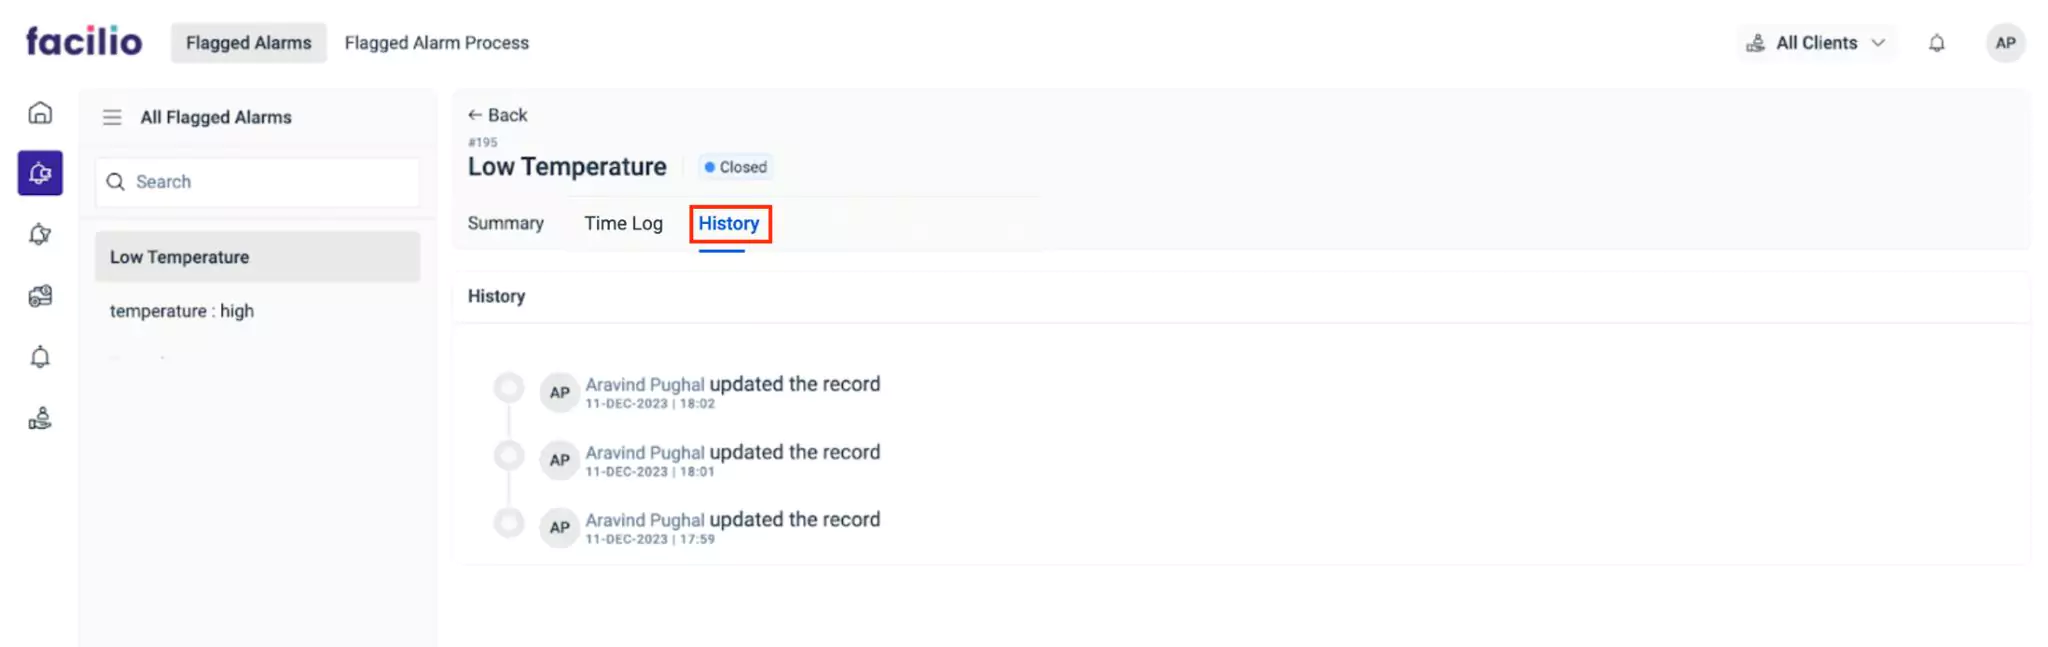
History
The History section maintains the log of all activities related to the flagged alarm activity, for future reference. The recorded information helps in understanding the course of action or changes the record has undergone.