Working with KPIs
KPI (Key Performance Indicator) is a standard measurement that professionals use to measure their progress towards their business goals. In facility management, KPIs assist facility managers in identifying problem areas and making plans for increasing reliability, sustainability, safety, and regulatory compliance. They provide valuable insights into day-to-day operations and show how well the building performs.
You can navigate to the KPI section of the Analytics module to perform mathematical operations on two or more readings and derive the final value. The KPIs configuration screen appears as shown below.
The upcoming topics illustrate how to create and manage the Module KPIs and Reading KPIs, and explain the other functionalities included in this section.
Managing Module KPIs
The module KPIs are created to monitor the performance metrics pertaining to individual modules and derive the information required to plan process improvement strategies accordingly.
For example, you can create KPIs to monitor the number of work orders, cost of labor, occupancy capacity of assets, and so on. A module KPI thus created ultimately compares the latest metric data against the safe limit set and notifies the end users in case of any violations observed.
To create a module KPI,
Navigate to Module KPIs. The configured KPIs appear as shown below.
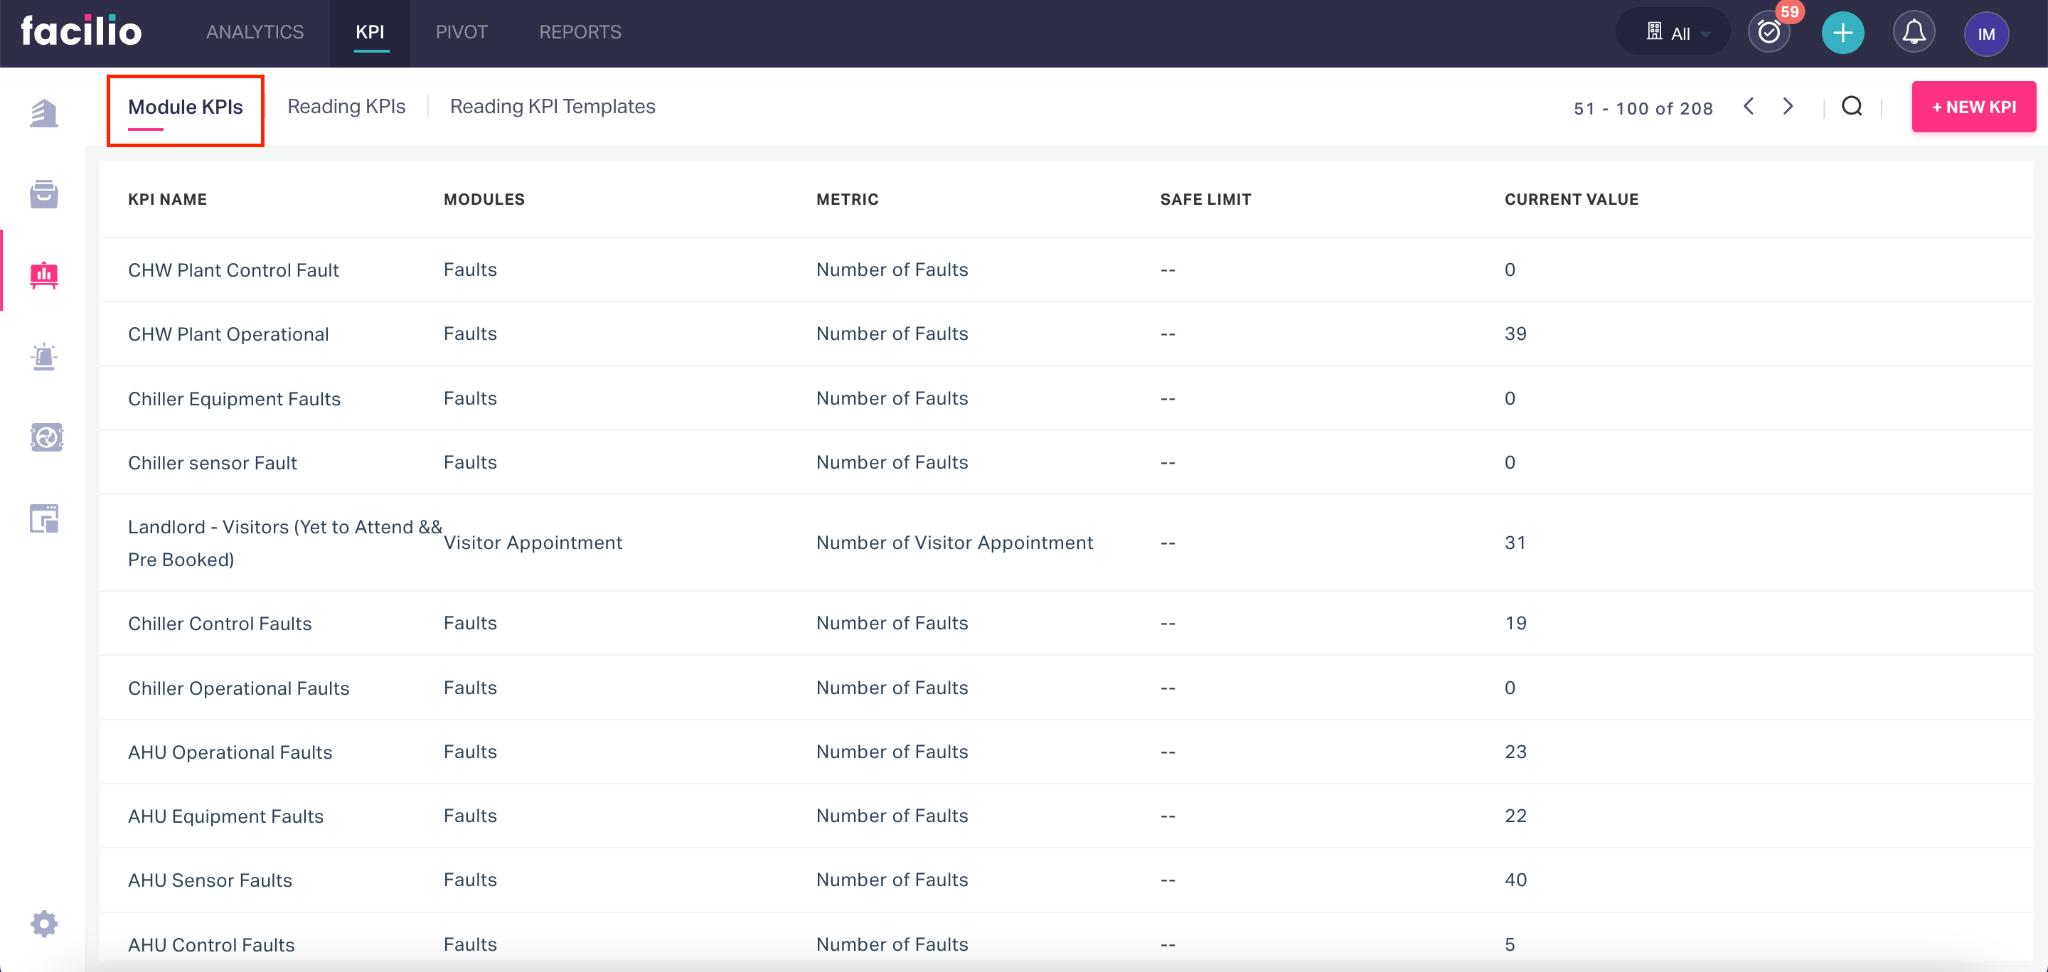
Click +NEW KPI. The NEW KPI DEFINITION window appears as below.
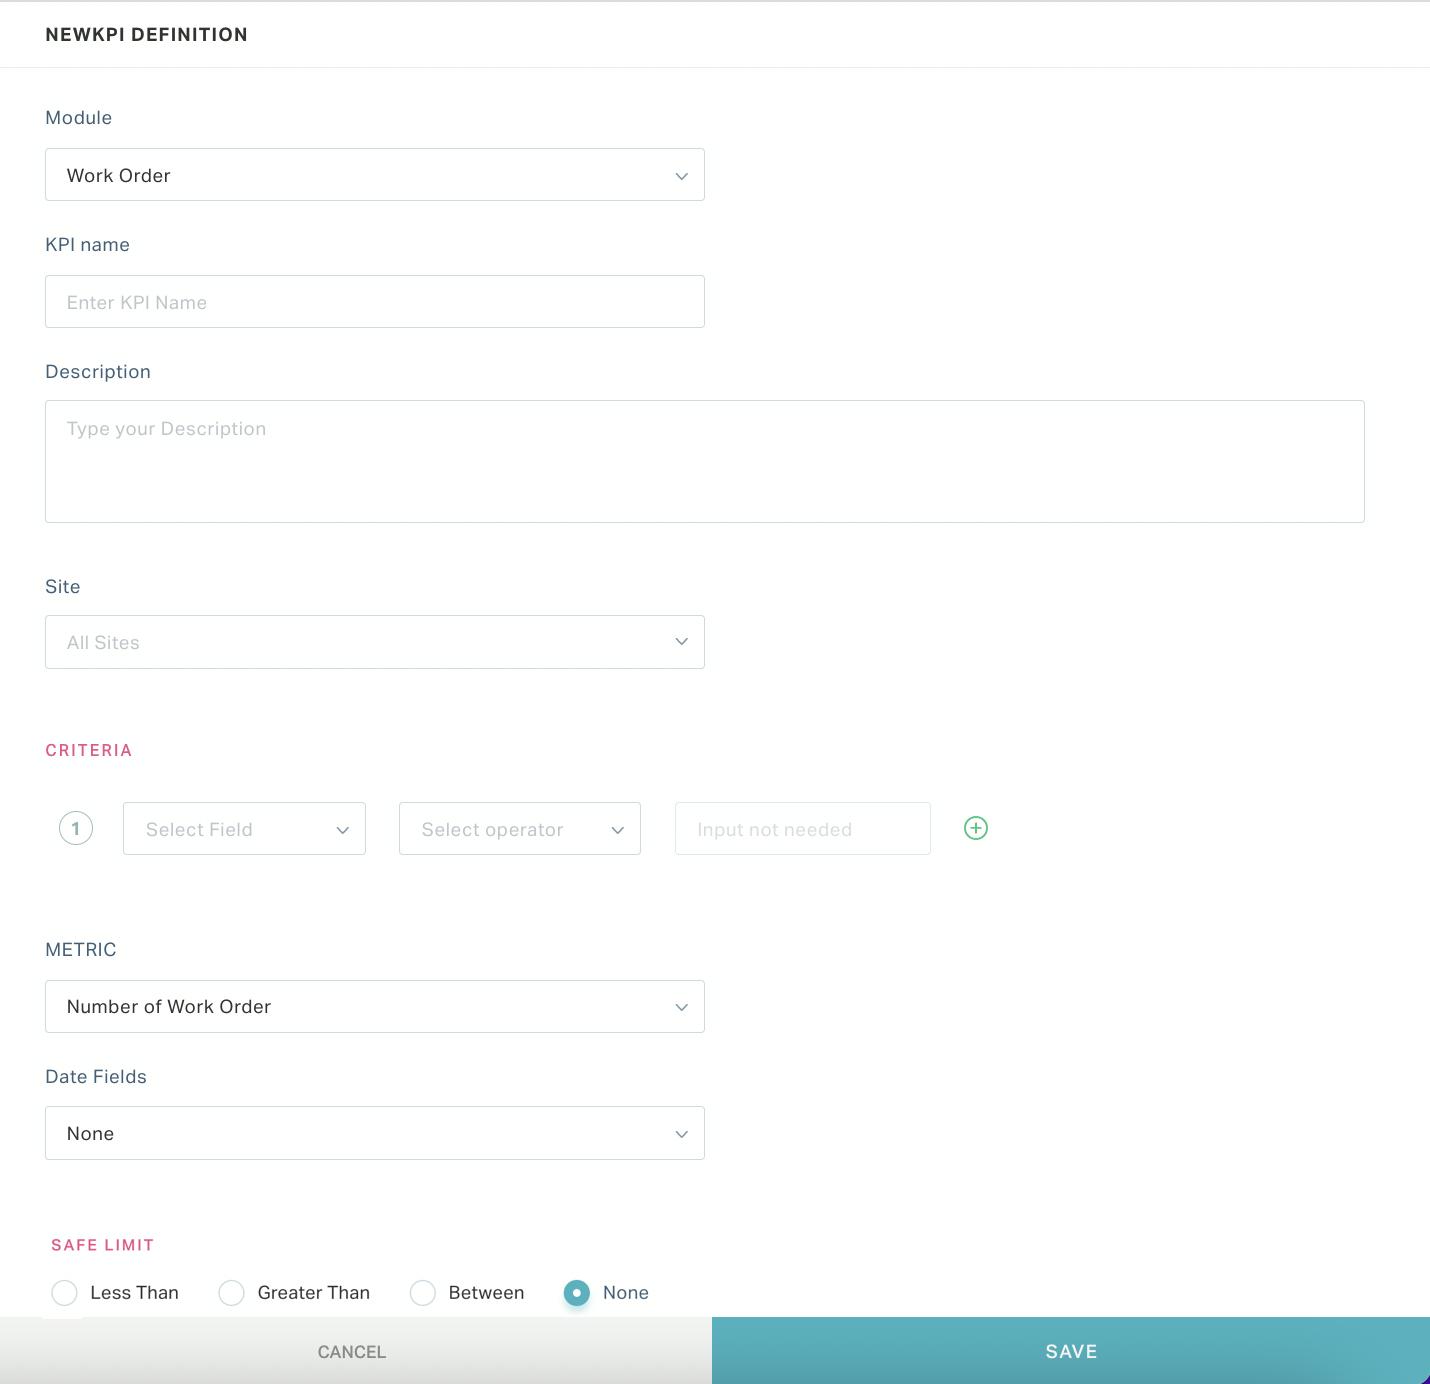
Update the following fields in this screen:
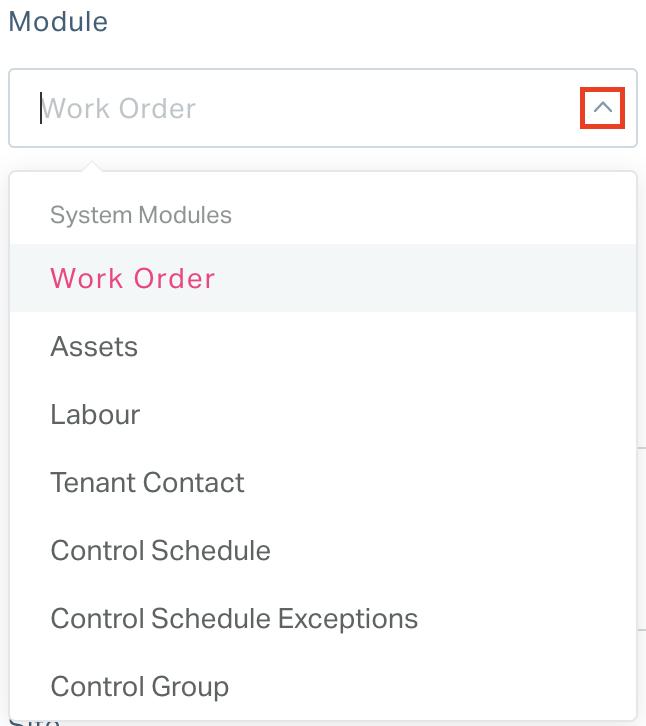
Module - The module corresponding to which the KPI is being created
KPI name - A label to identify the KPI created
Description - A short description explaining the purpose of the KPI
Site - The site whose data must be considered for the KPI calculation
Criteria - The condition based on which the data applicable for the KPI is filtered.
Note: You can use the
 and
and  buttons to add or delete criteria. In case of multiple criteria, you can choose to match all or selected criteria using the Match All and Match Any options.
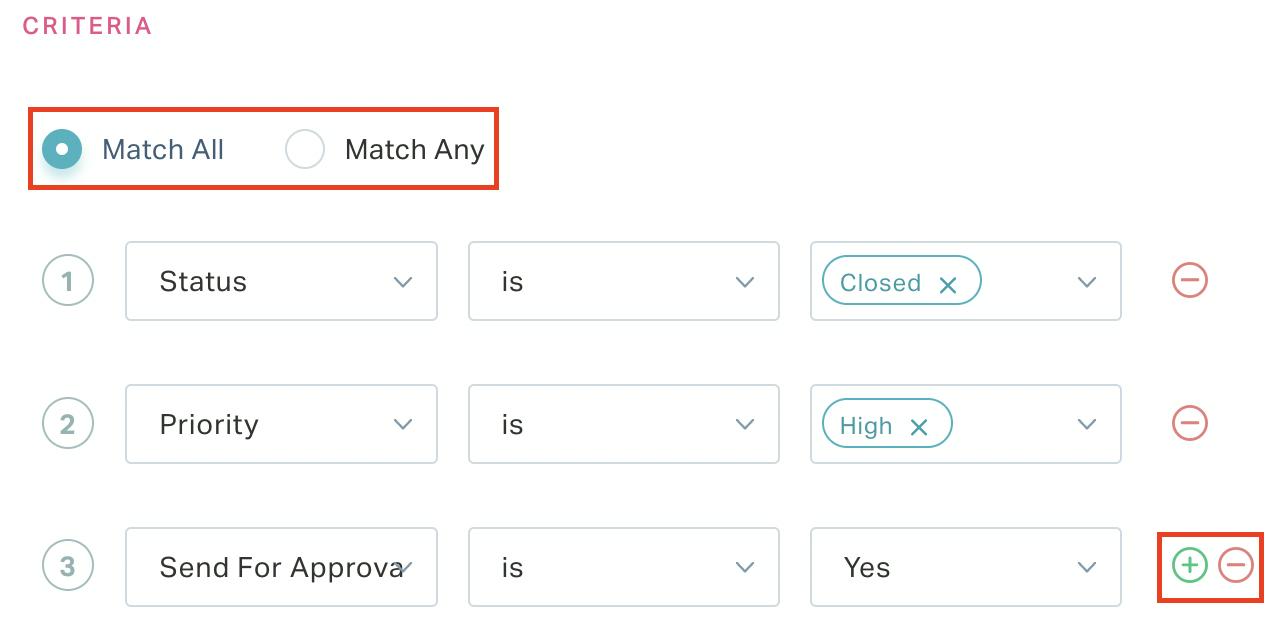
Metric - Measurement parameter of the selected module
Date Fields - The attribute based on which the time filter is applied for the KPI
Periods - The specific time frame to filter the data applicable for the KPI calculation
Safe Limit - The checkpoint to identify the instances crossing the bounded value
Note: The fields displayed in the above screen may vary with respect to the selected module.
Click SAVE. The module KPI is now successfully saved.

Note: The module KPI thus created can also be added to the dashboard for quick reference. .
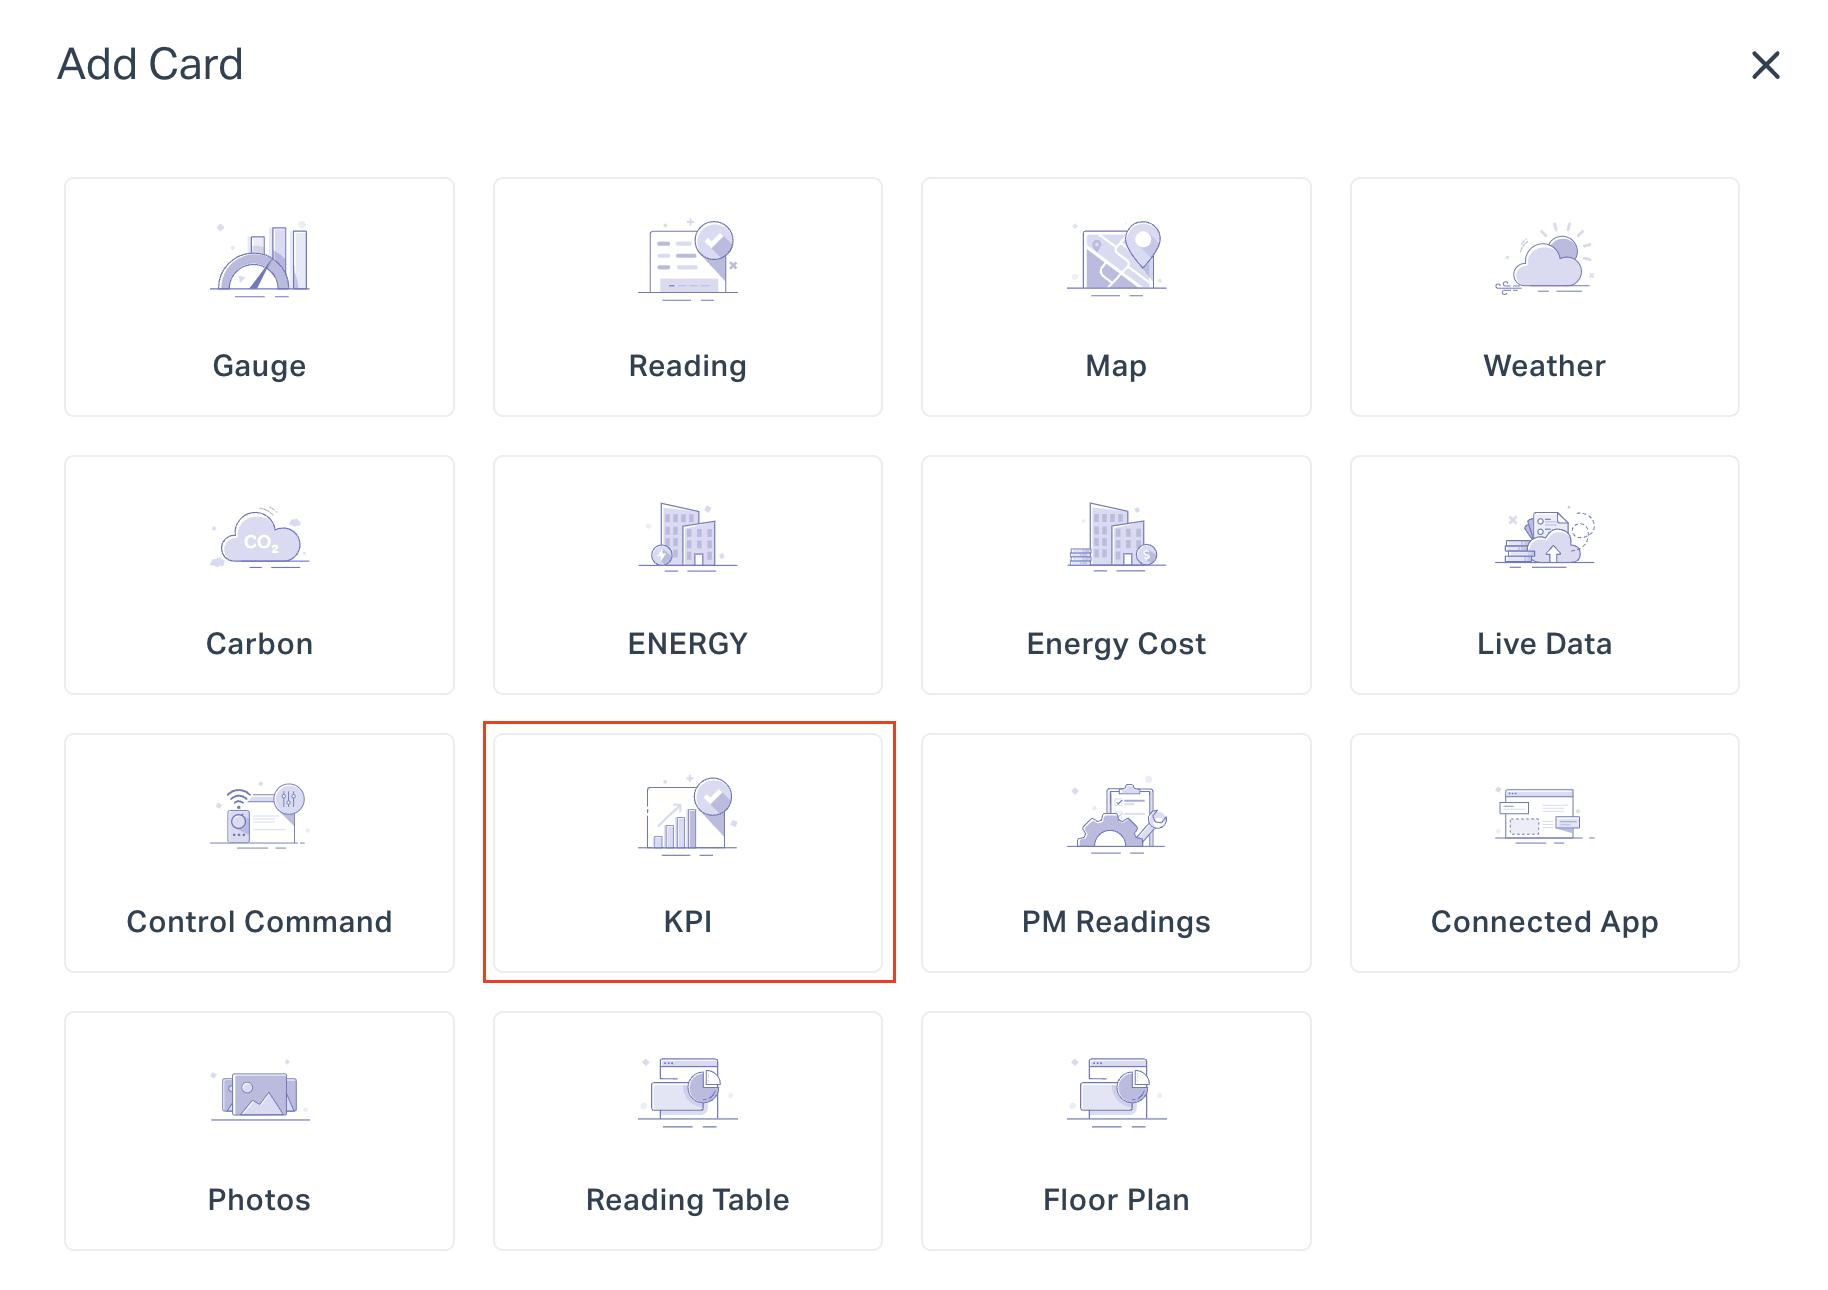
Read the Add Card section in the View and Dashboards feature for more information.
Managing Reading KPIs
The reading KPIs are created for both asset and space to perform the required calculations between the selected readings, by creating a mathematical expression. For example, you can create KPI to calculate the overall energy consumption for a building, the number of visitor appointments recorded for a site, the total number of faults detected for an asset and so on. The KPIs thus created in this section are exploited as data points for configuring analytical reports to scrutinize the existing information and derive optimal solutions. Read the Working with Analytics section for more information.
Configuring Reading KPIs
Initially, to configure a reading KPI, you must create a virtual space or asset to accommodate the resultant values of the KPI calculation. In other words, the virtual element thus created is used to tag the reading KPI against it. This KPI in turn can be added as a dimension to the analytical report upon choosing the virtual element (asset or space), while configuring the data points.
To create a reading KPI,
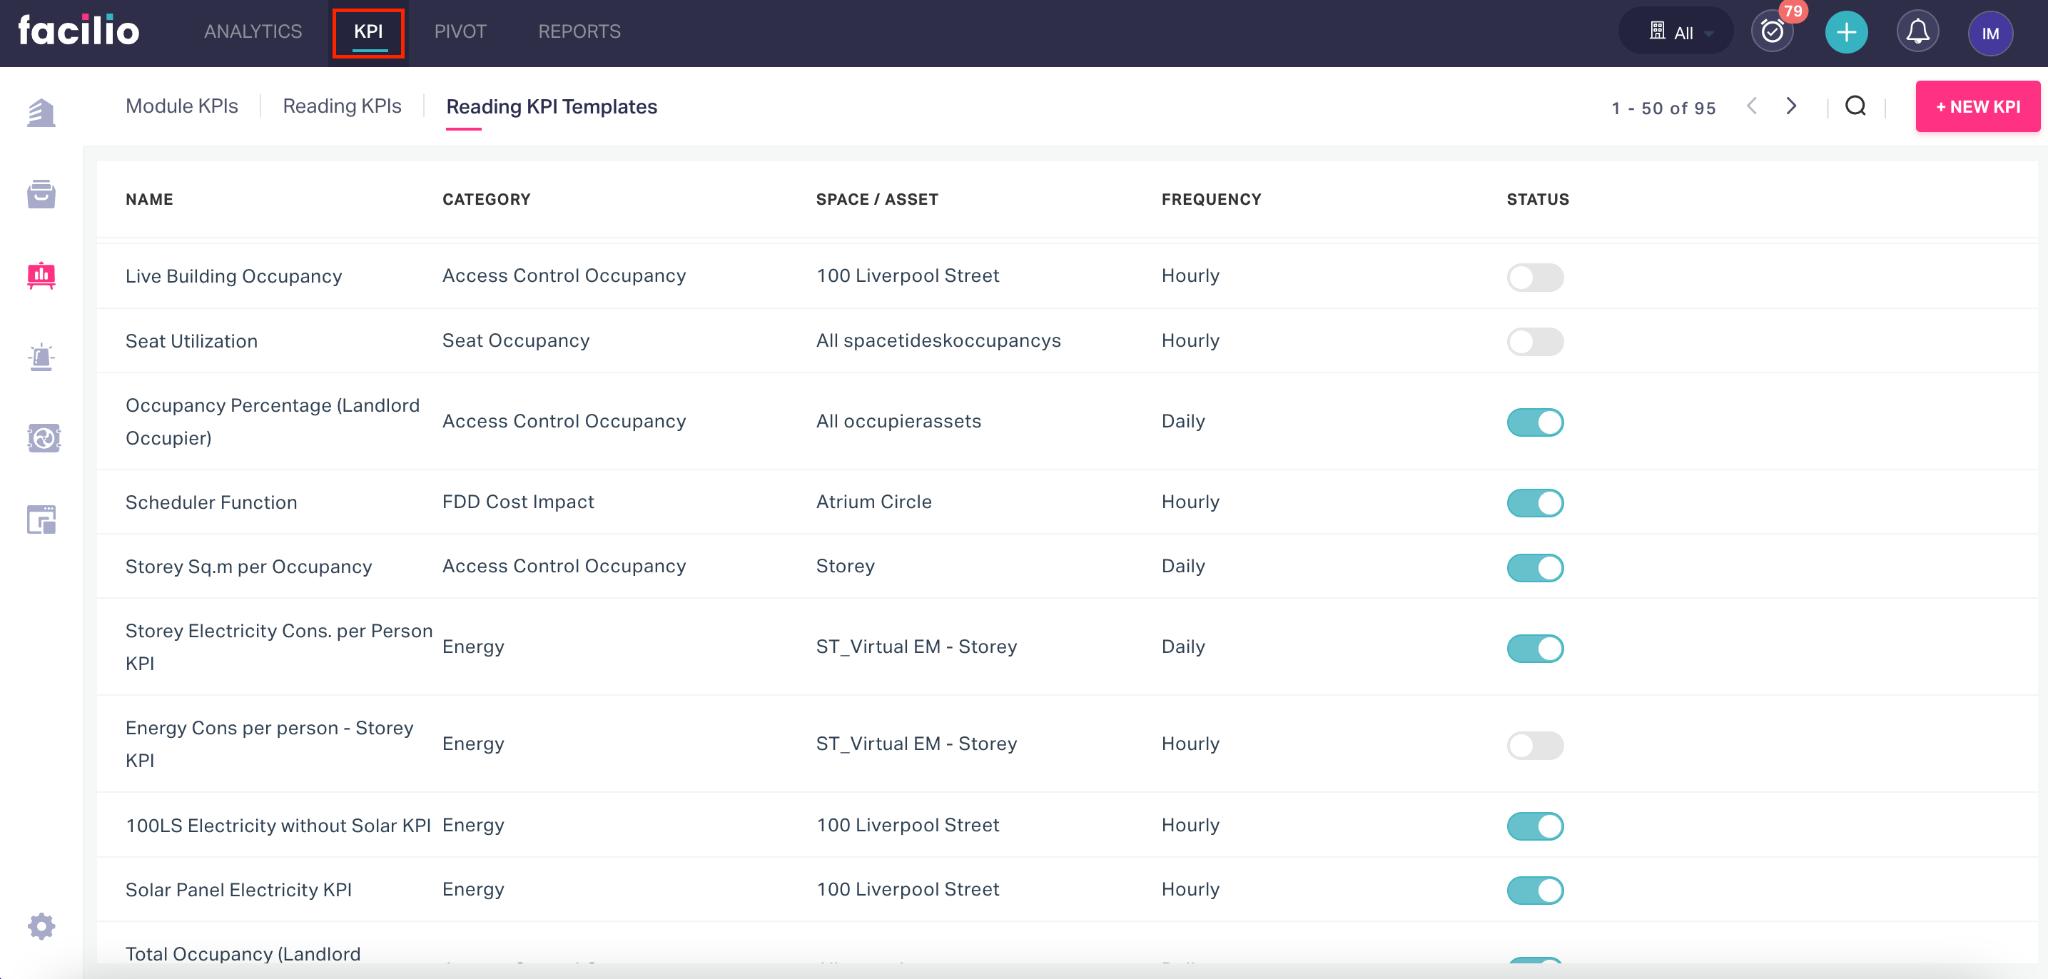
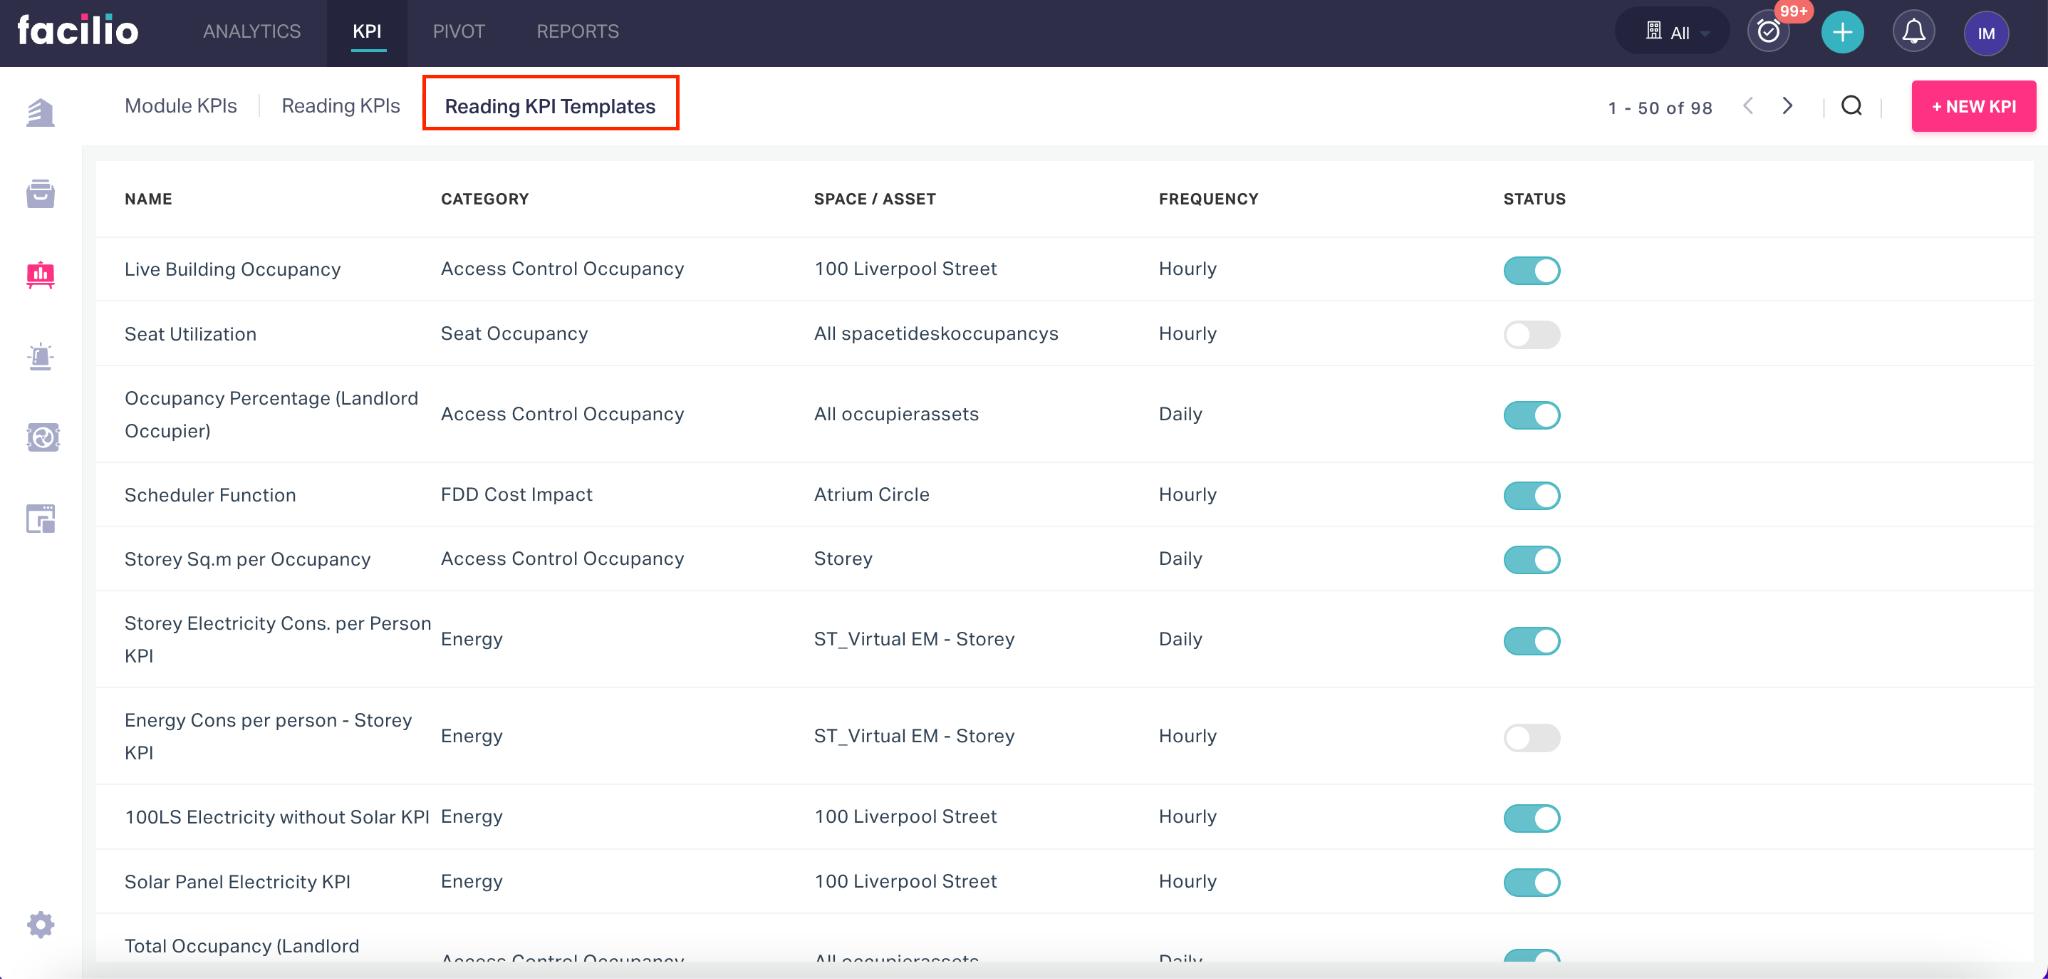
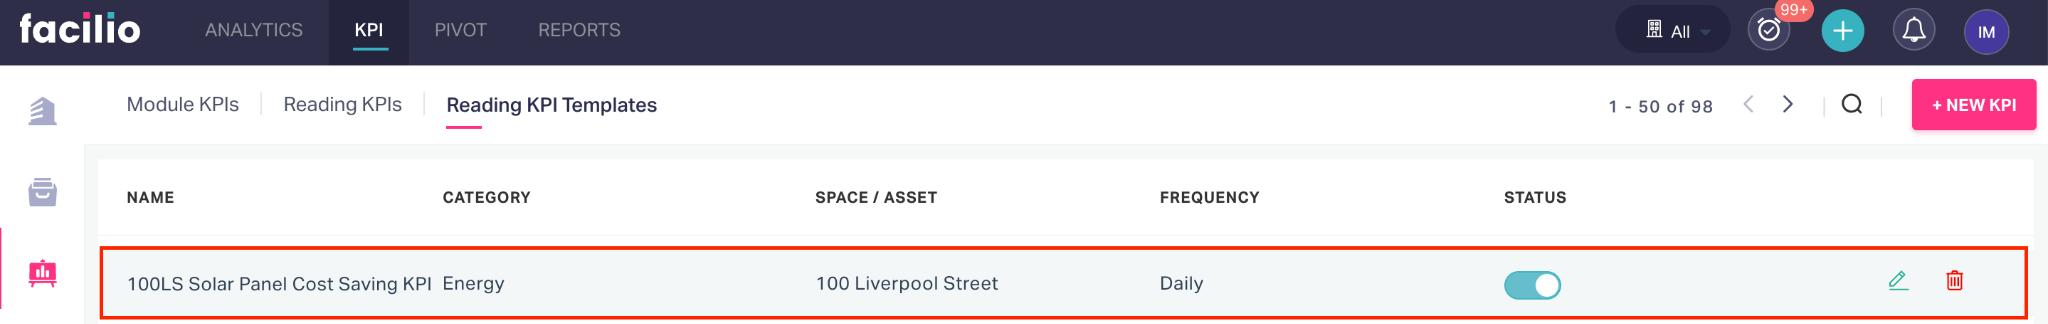
Navigate to the Reading KPI Templates section. The existing reading KPIs are displayed as shown below.
Click +NEW KPI. The NEW KPI DEFINITION screen appears.
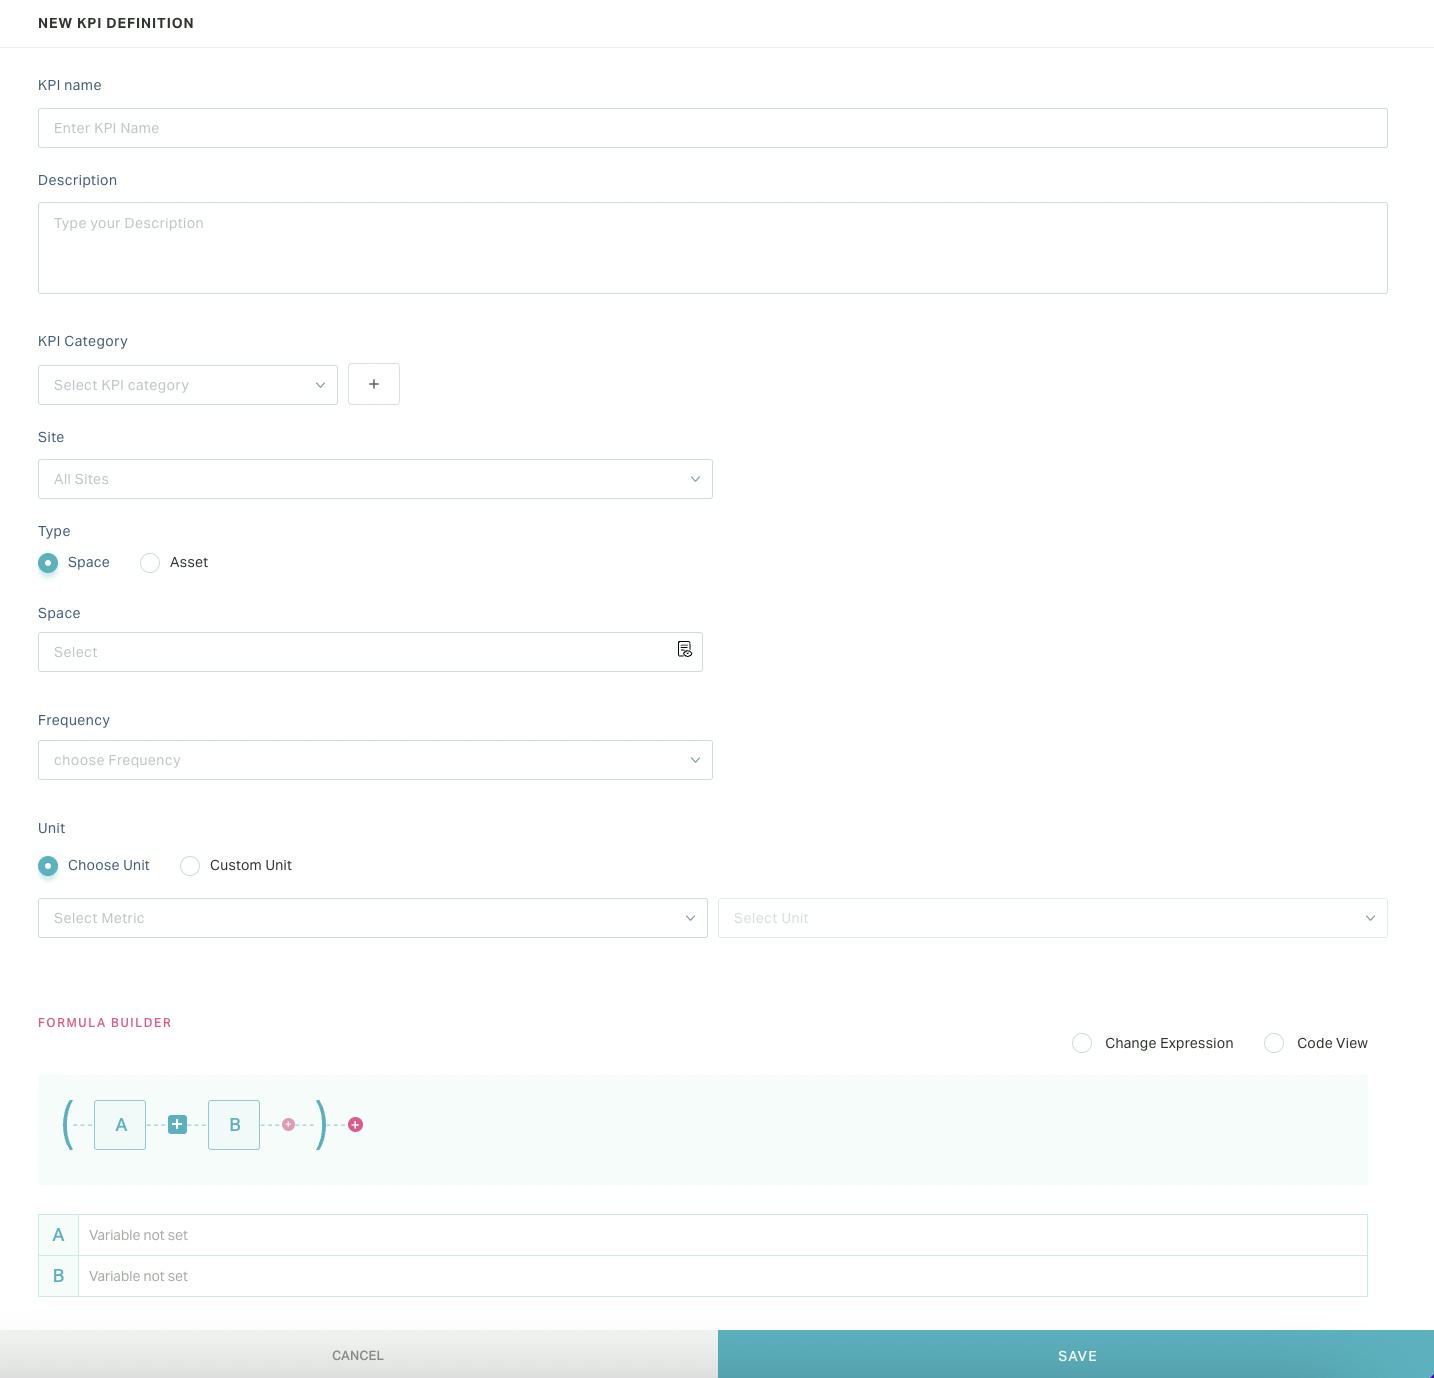
Update the following fields in this screen:
KPI Name - A label to identify the reading KPI
Description - Ashort note explaining the purpose of the KPI
KPI Category - The classification to define the type of the KPI
Note: You can choose a category from the existing options or click
 to add a new category.
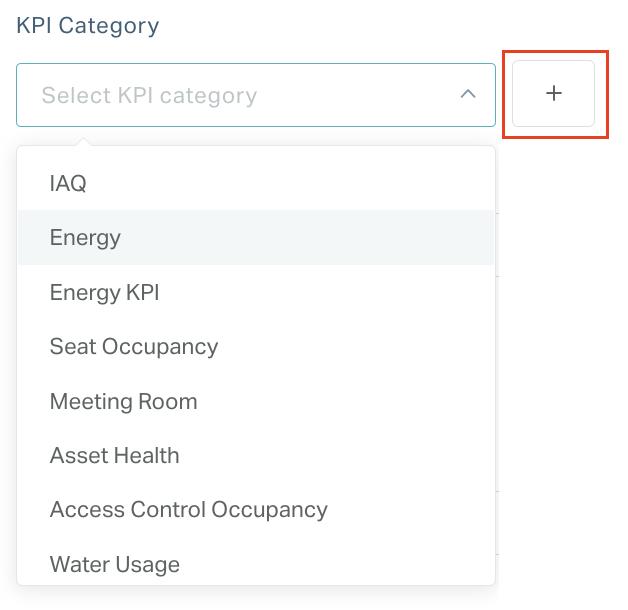
Site - The site for which the KPI template is being created.
Type - The type of the reading KPI. You can choose from the following options:
- Space
- Asset
Note: This field must be set to the virtual space or asset created to accommodate the resultant KPI value.
Frequency - The interval at which the KPI calculations are to be performed.
Example: Hourly, daily, monthly and so on
Unit - The unit of measurement that applies to the KPI value
Note: You can select a Custom Unit to define your own option.
Formula Builder - A mathematical expression to calculate the KPI value. Read the Creating a Formula section for details on how to configure the KPI formula.
Click SAVE. The reading KPI is now updated successfully.
Creating a Formula
Formula builder allows you to create an equation to perform KPI calculation among the selected variables. You can set components such as an asset reading, space reading, and so on as a variable while building a KPI formula. This section illustrates a sample configuration to add the readings of two energy meters. To build the formula,
Click
 (variable A) and set the reading parameter corresponding to the first energy meter.
Click
 (variable B) and set the reading parameter corresponding to the second energy meter.
Set the mathematical operator as
 (plus) to add both the readings.
Note: The
operator is set in the expression by default. You can click the  sign to switch to
  ,
,  , and
, and  operators with respect to the calculation being performed.
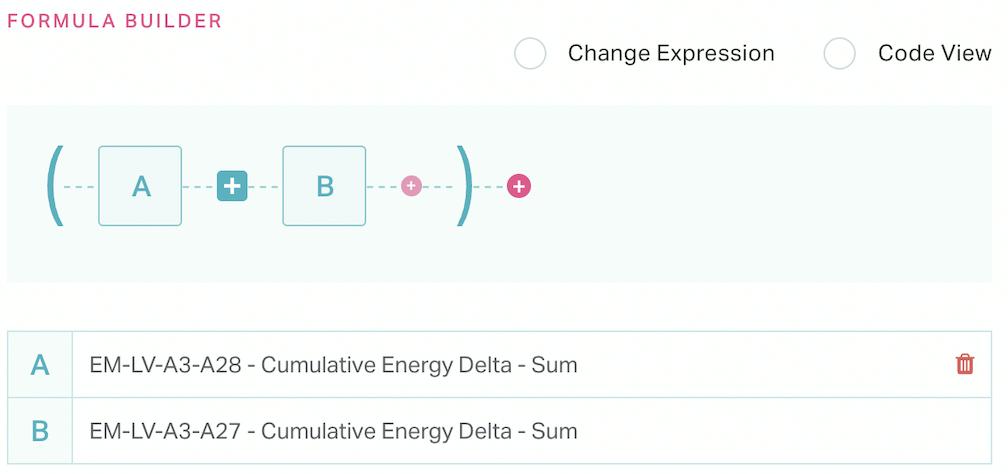
You can use the
 and
and  icons to add and delete a variable in the expression. In case a new variable is added, you should set the corresponding parameter by clicking the variable in the expression.
Alternatively, the application provides you with the following interface options to build the expression:
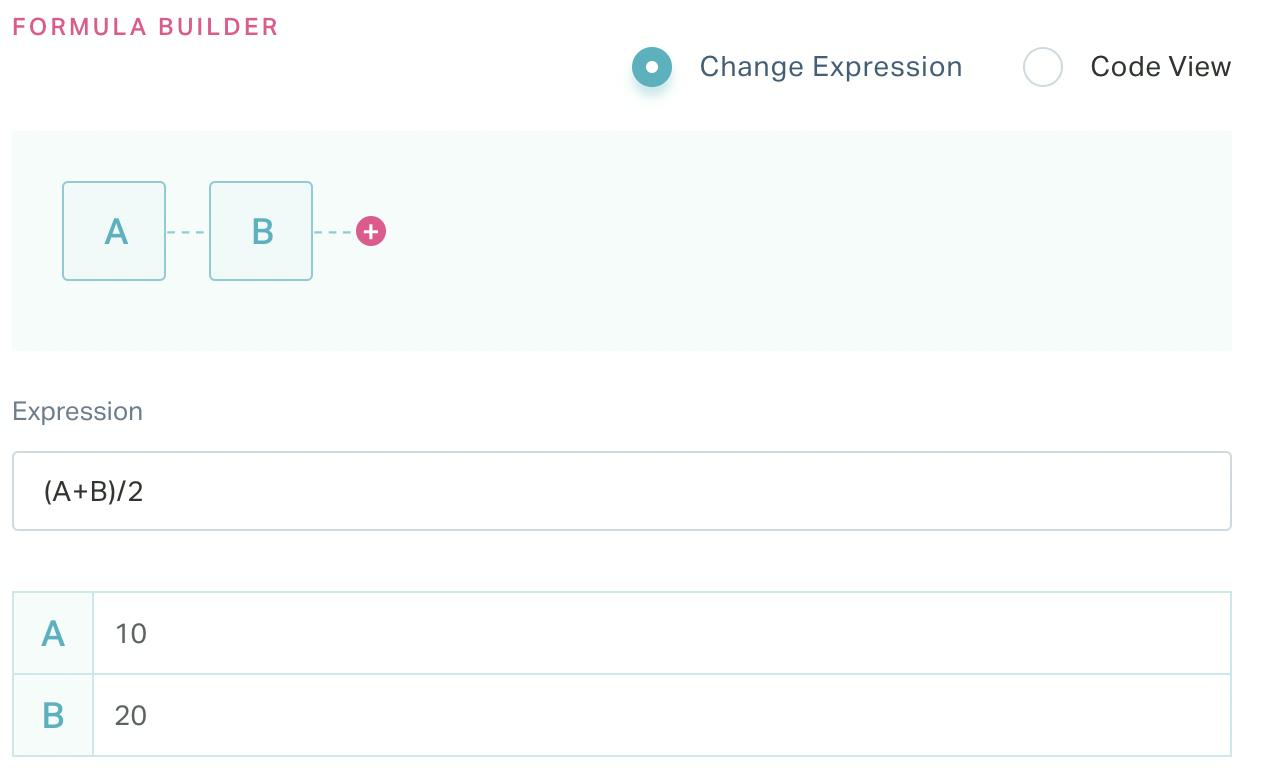
Change Expression - Allows you to directly type the expression to be used for calculation, instead of configuring the expression. You should enter the formula in the Expression field as shown below.
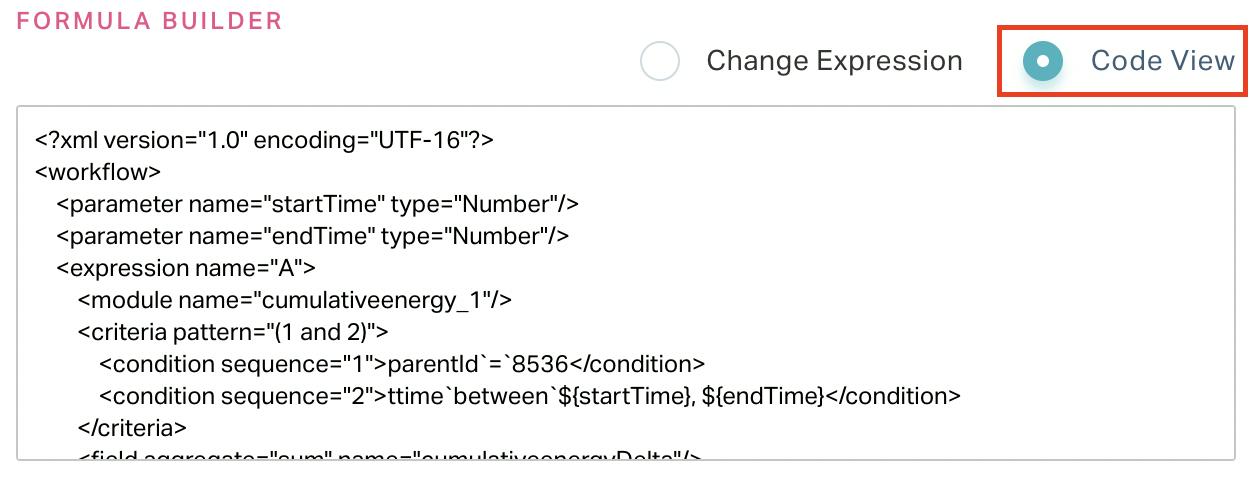
Code View - Allows you to configure the expression using XML code. You can also customize the configured expression in the code view as shown below.
Accessing and Computing the KPI Details
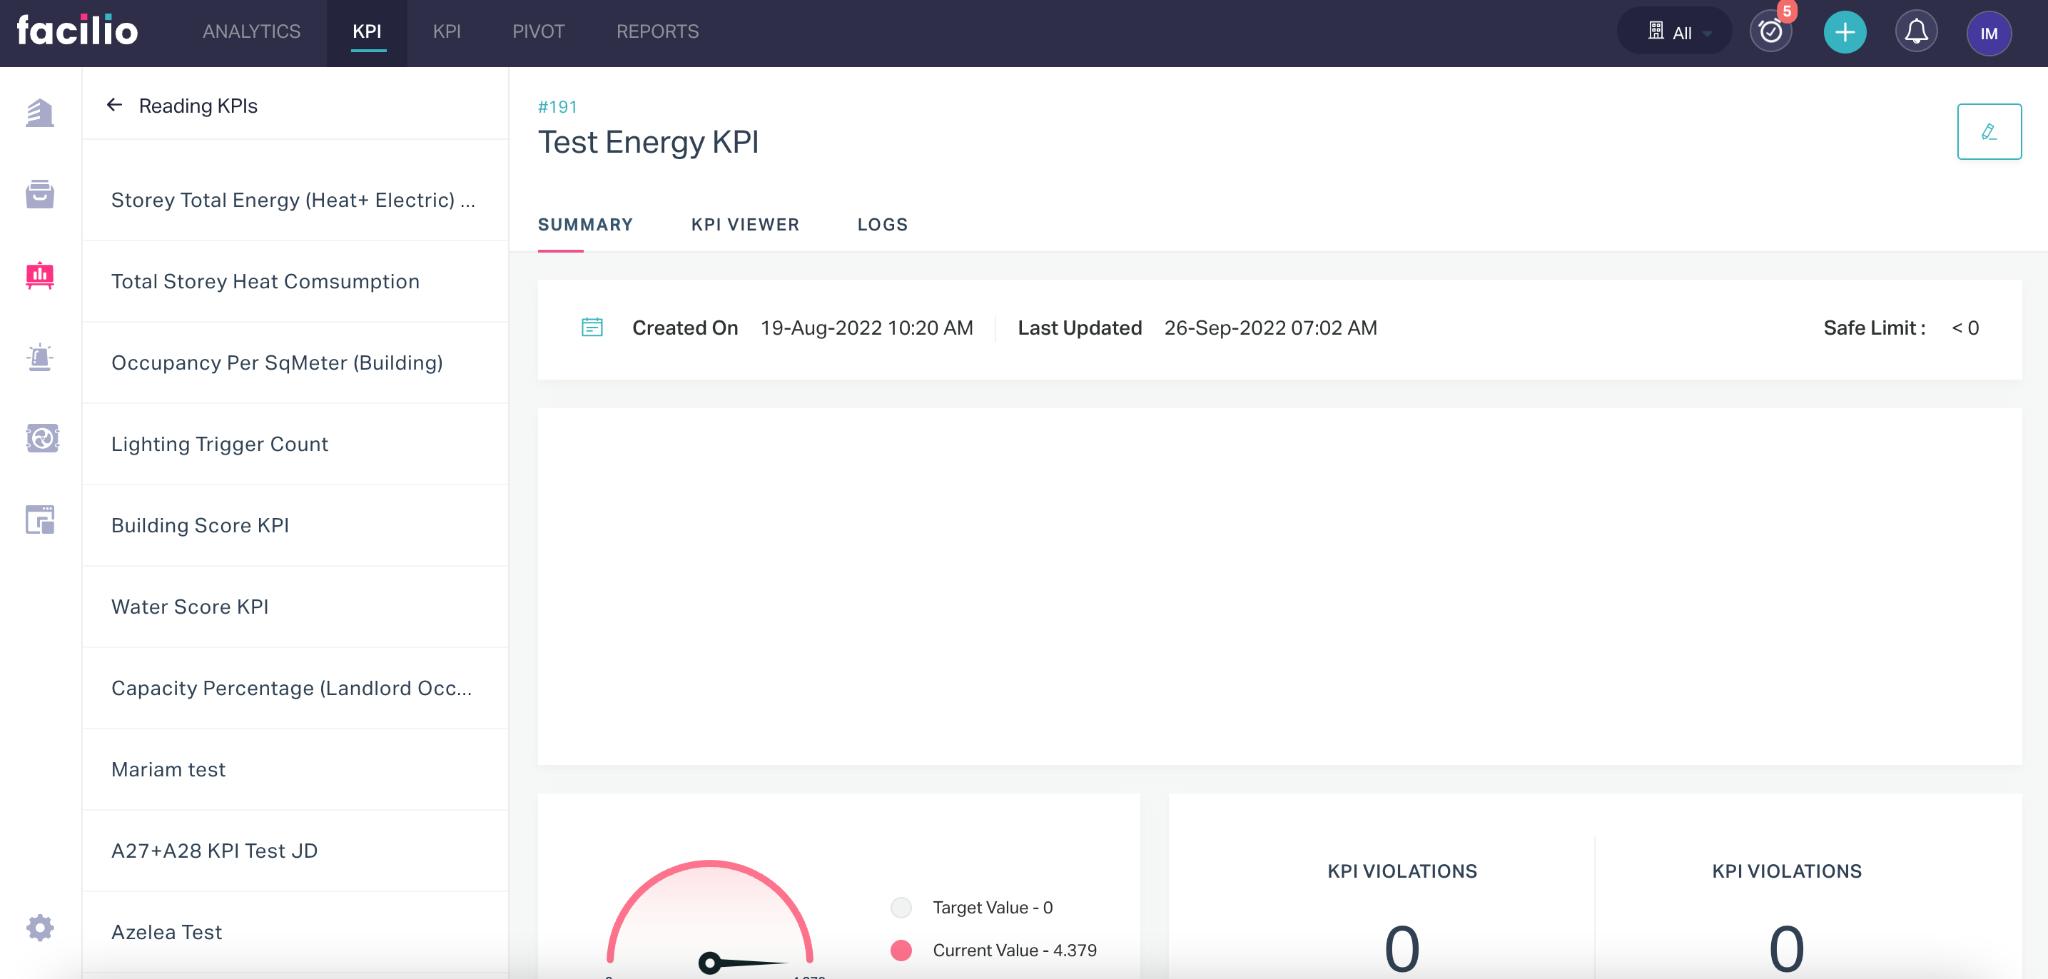
You can view the details of the reading KPI by clicking on the KPI name. Upon clicking a KPI name, the SUMMARY screen appears by default as shown below.
The reading KPI details are grouped under the following sections.
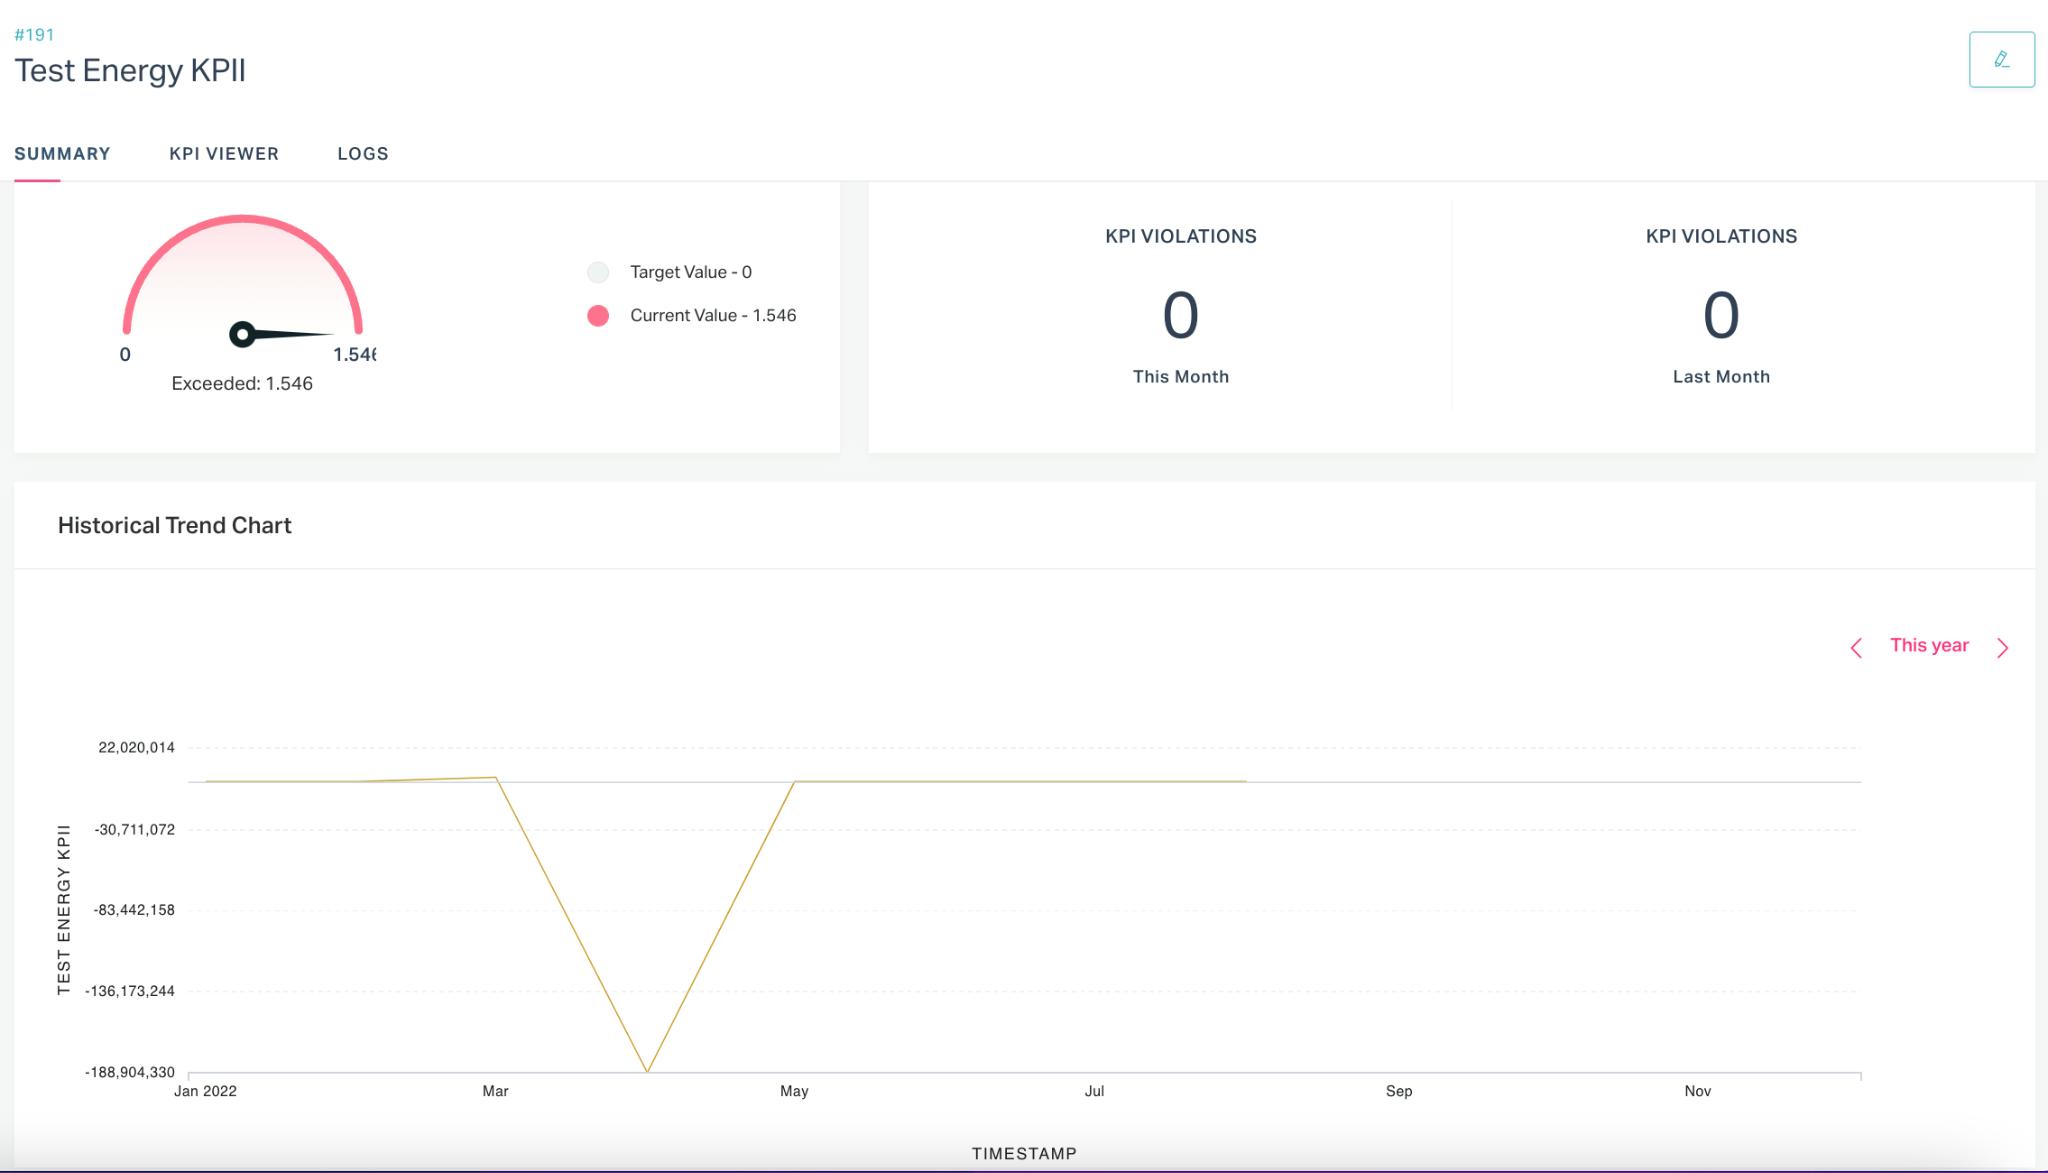
Summary
The SUMMARY section displays the overall basic information of the KPI. It includes the creation date, last updated date, safe limit, target value, current value, KPI violations, and historical trend chart.
KPI Viewer
The KPI VIEWER section depicts the KPI trend based on the defined time interval. It also shows the safe limit, current value, sum, average, minimum and maximum values of a KPI.
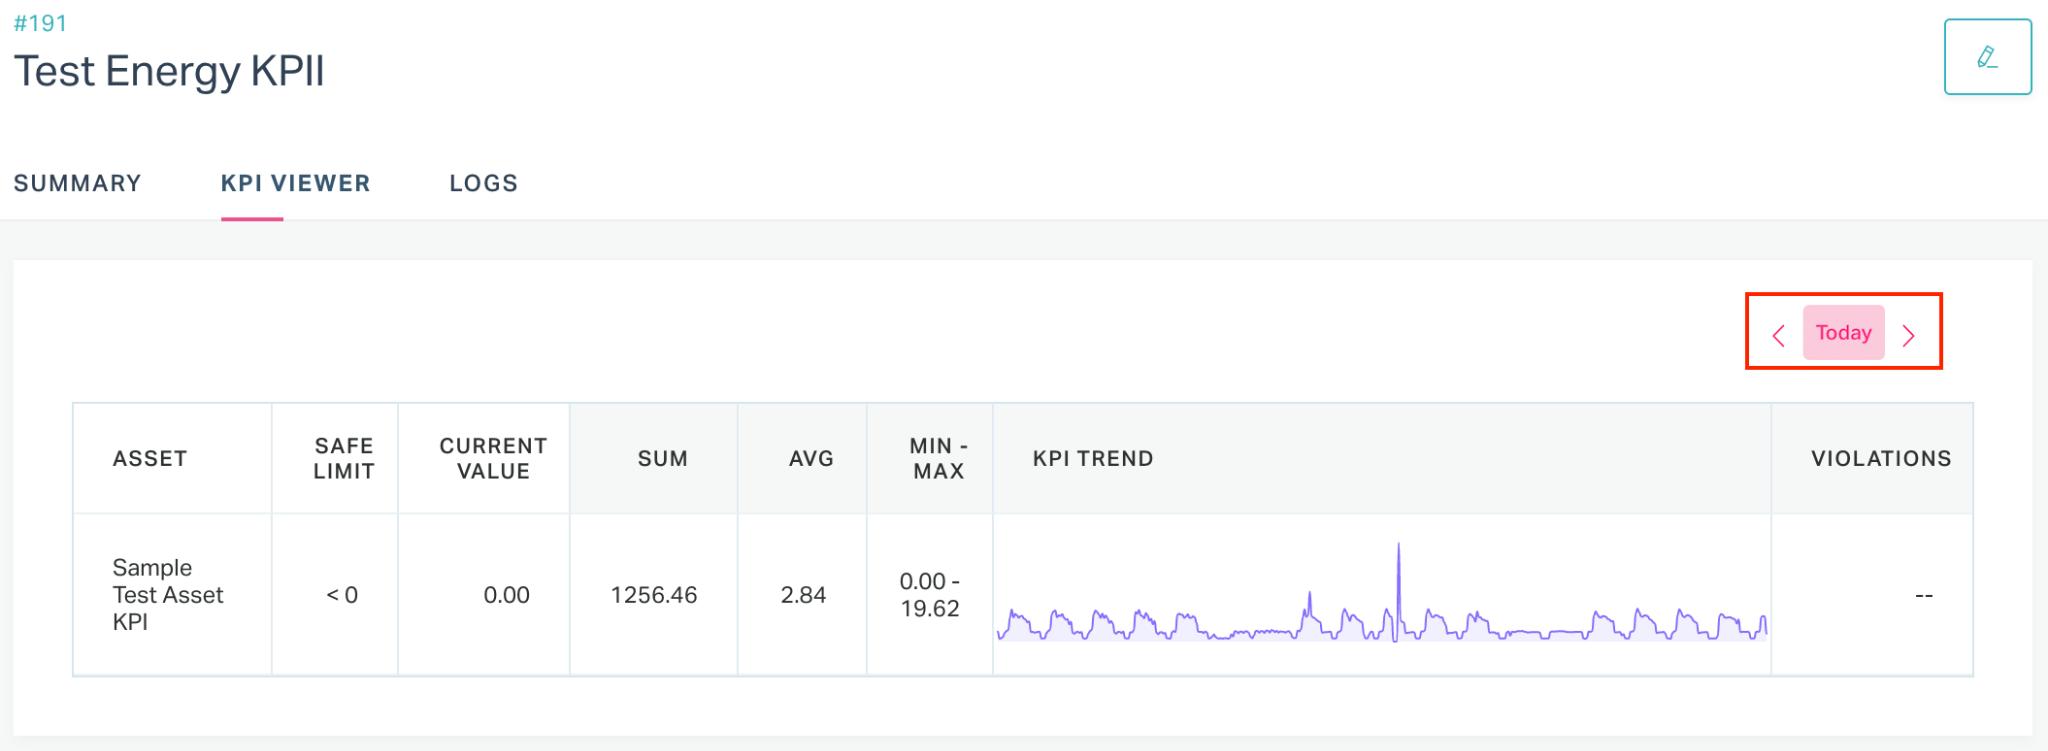
Note: You can change the KPI durationby clicking the date picker ( ) to view the KPI values for a different time range.
Logs
The LOGS section lists all the instances of the KPI calculations carried out. You can use the Run Historical Data link to perform the KPI computation for a definite time period.
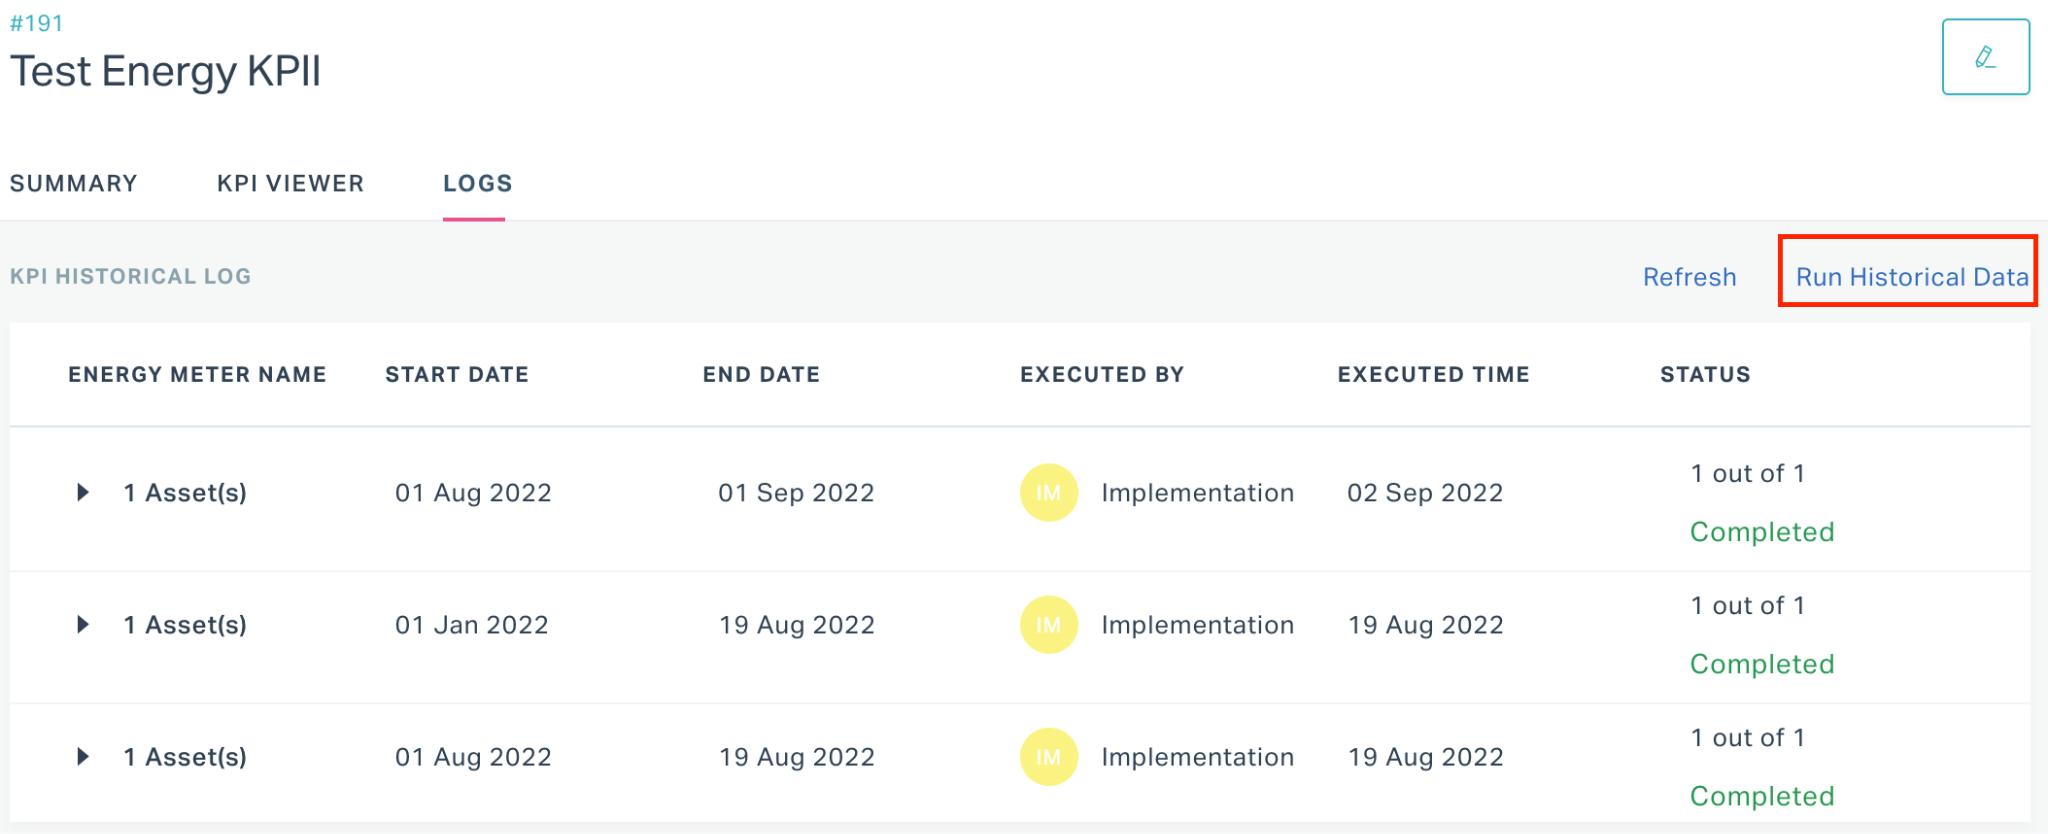
Note: The Refresh link is used to view the updated KPI calculation status.
Viewing Reading KPIs
The Reading KPIs section displays the values calculated for the KPIs configured, defining where the values fall and showing the trend on how the values have changed over time.
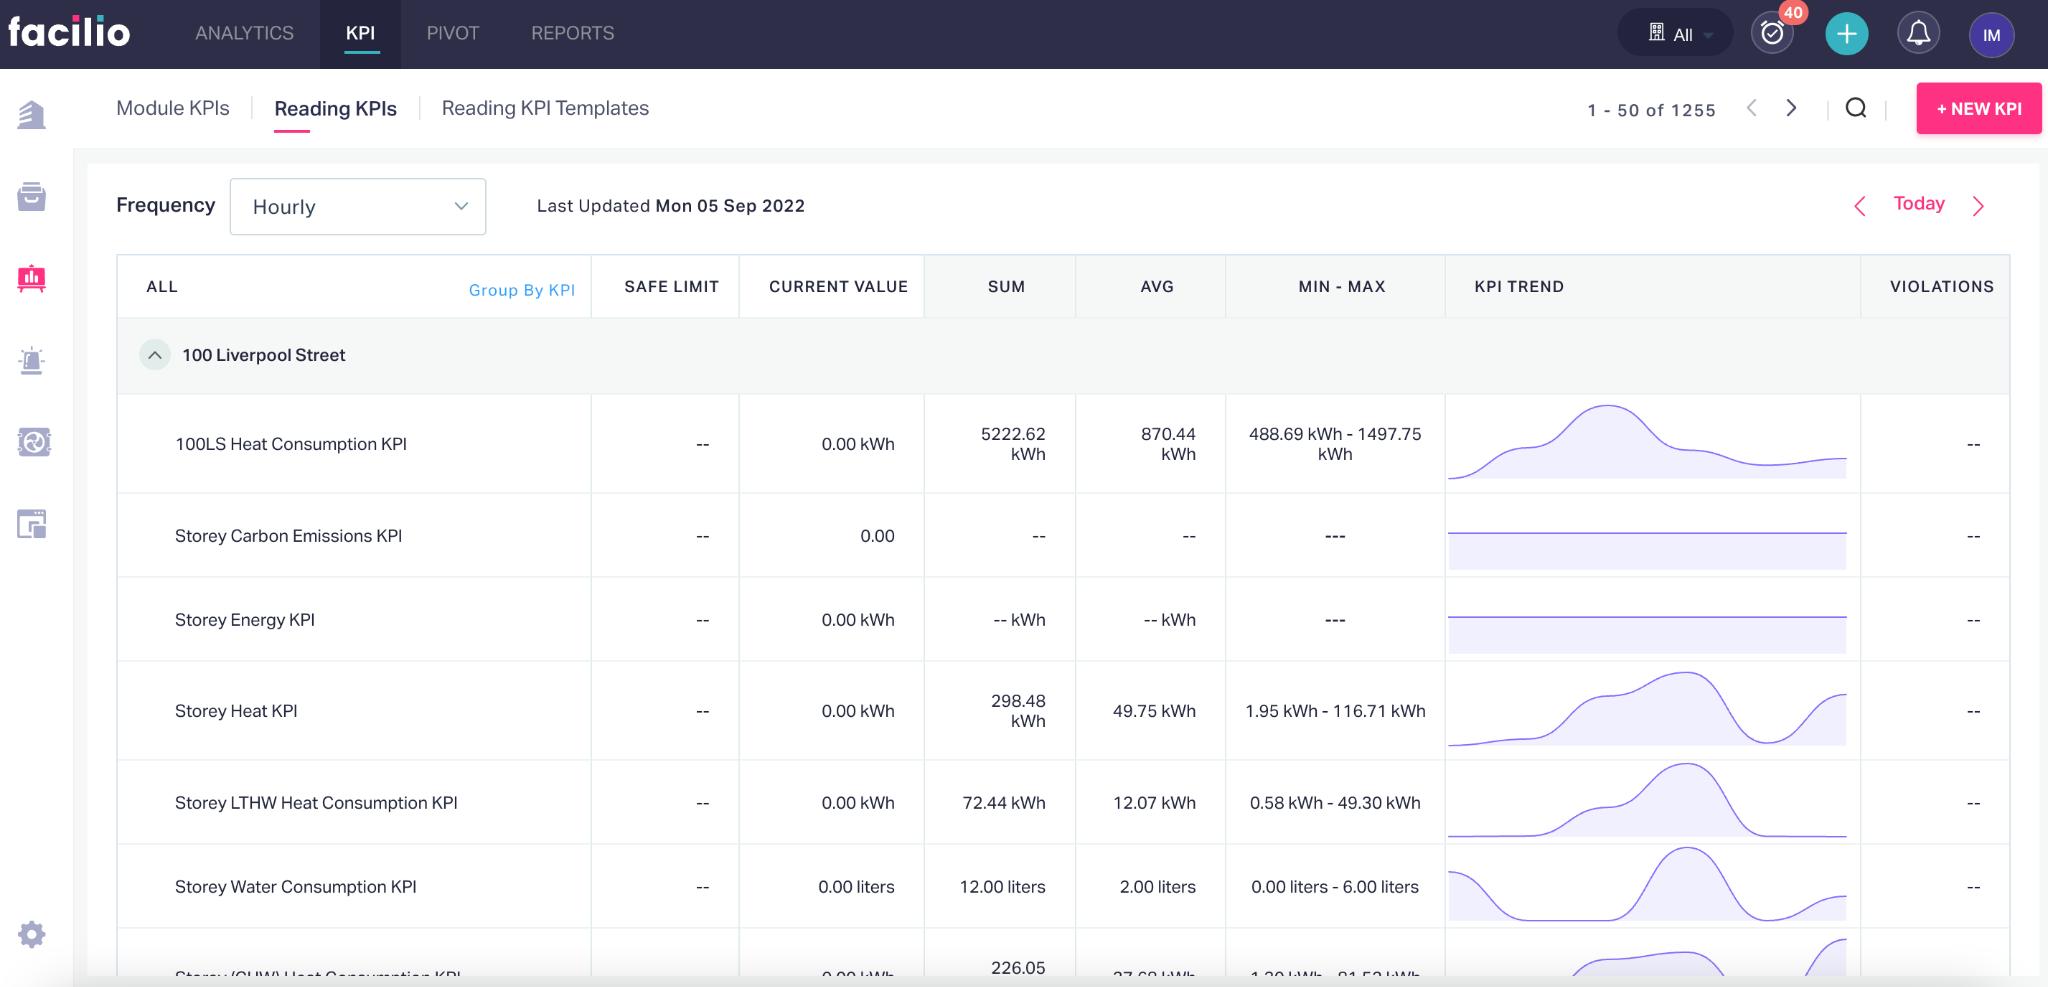
The Reading KPIs section displays the following components respective to the configured KPIs:
- Safe Limit - The safety limit defined for the selected metric
- Current Value - The latest reading of the metric chosen
- Sum - The sum all the readings recorded during the specified time frame
- Avg - The average of the readings recorded during the specified time period
- Min - Max - The minimum and maximum readings recorded
- KPI Trend - A simple graphical representation that depicts how the data values trend over a time period
- Violations - The violations observed (if any) with respect to the safe limit defined
There are certain features available in this section to alter the view or filter the required KPIs.
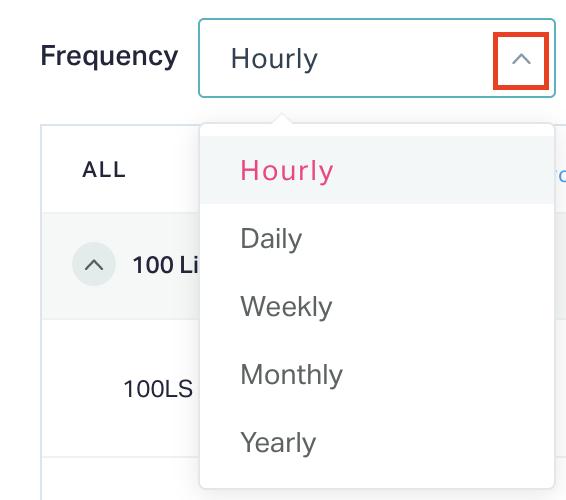
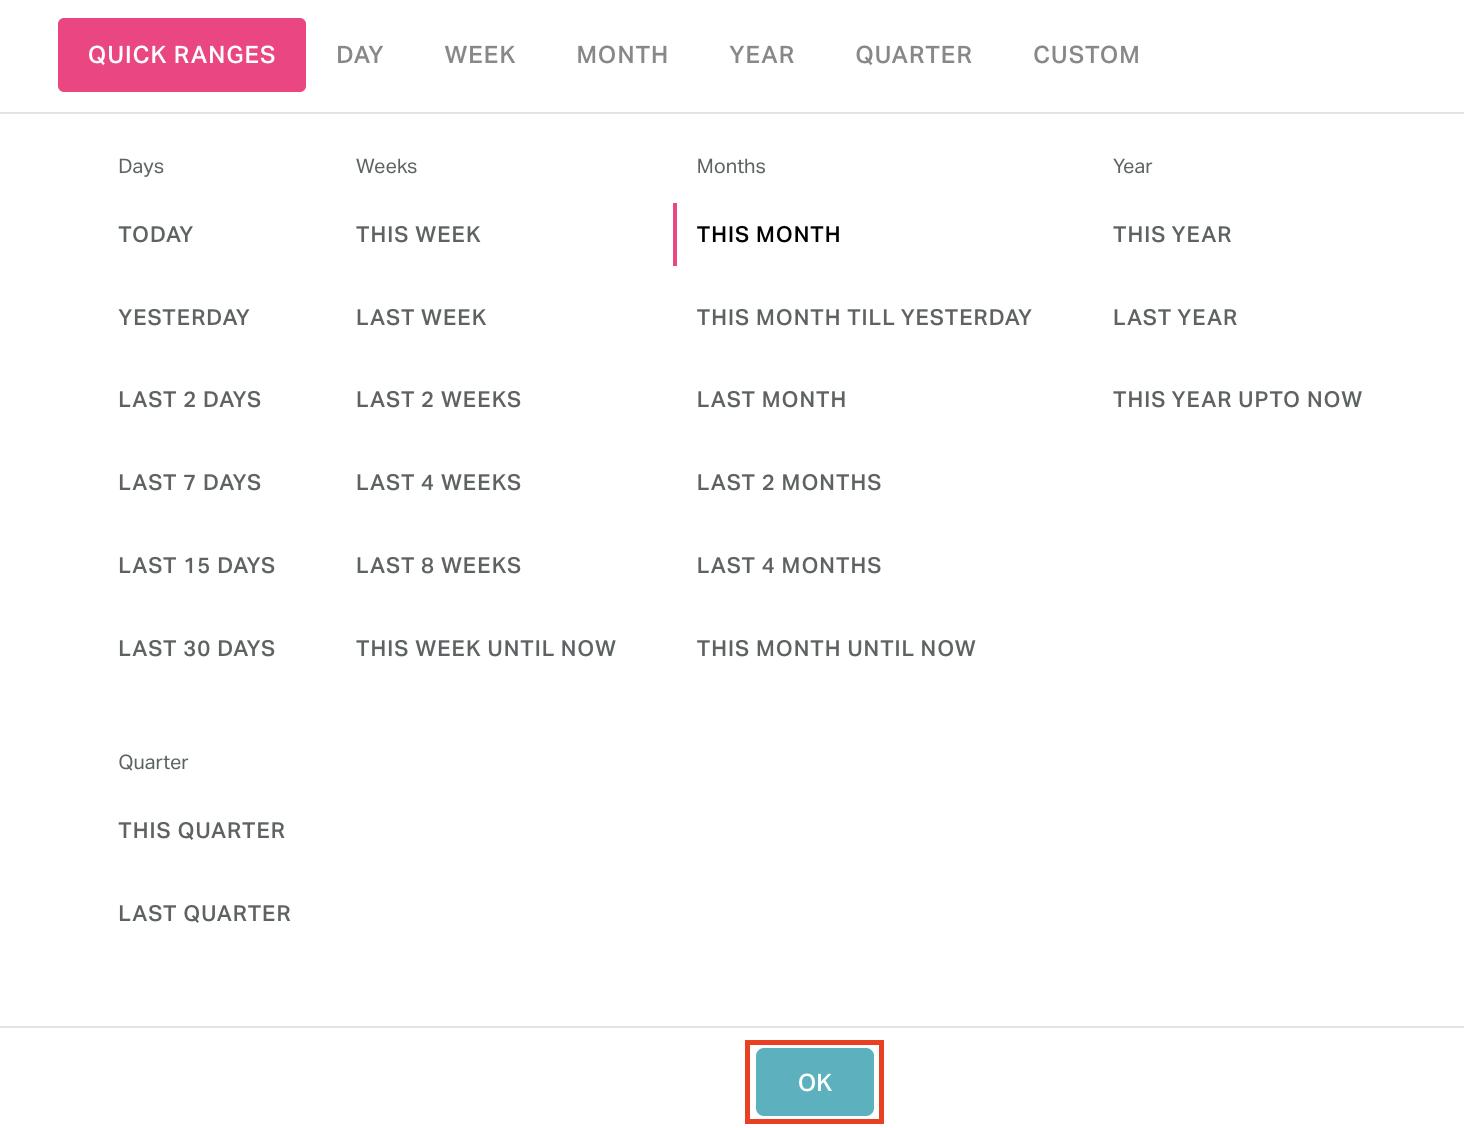
You can set the Frequency field to any of the following options to filter the KPIs that execute on the selected interval.
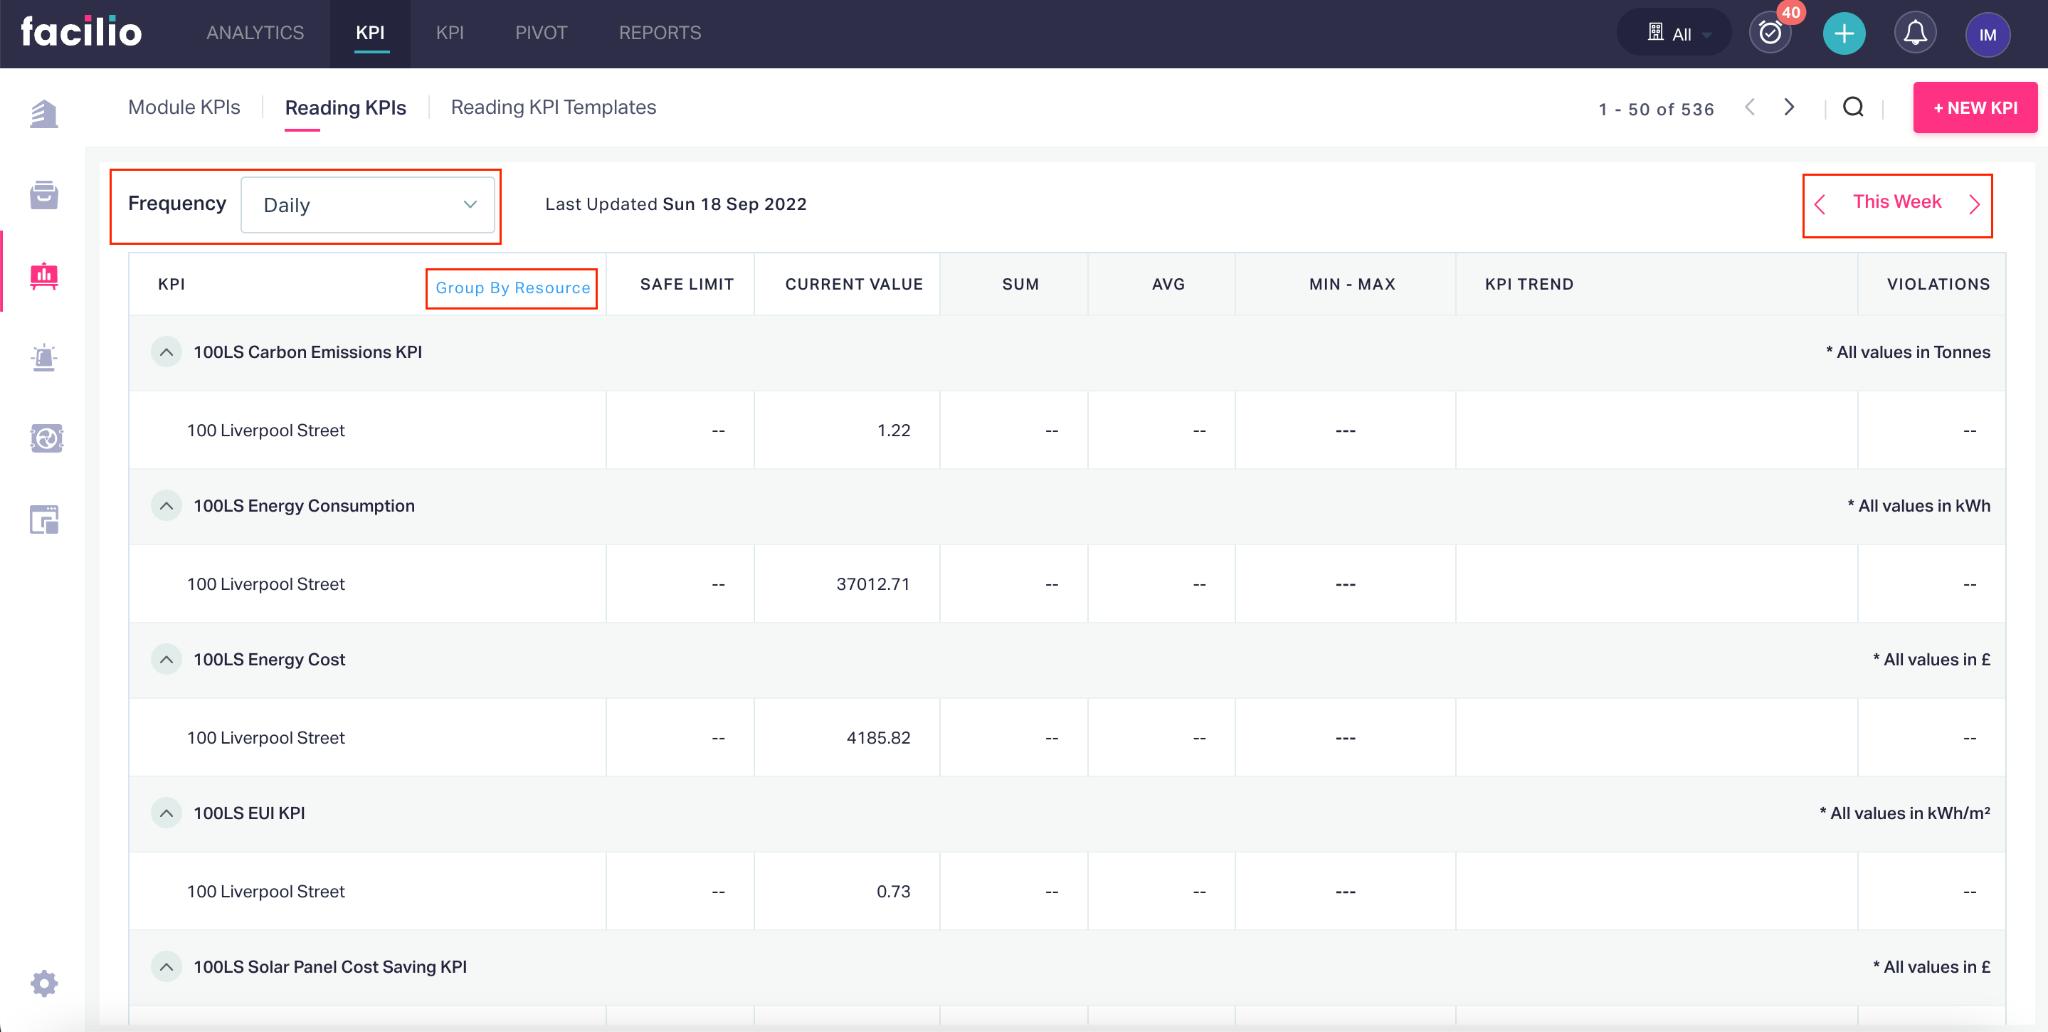
Also, you can use the date picker ( ) to choose a time range to filter the KPIs configured.
For easy access, you can group these values by KPI or resource upon switching between the Group by KPI and Group by Resource options, respectively.
Other Functionalities
There are certain functionalities and icons associated with this section that facilitate various other activities.
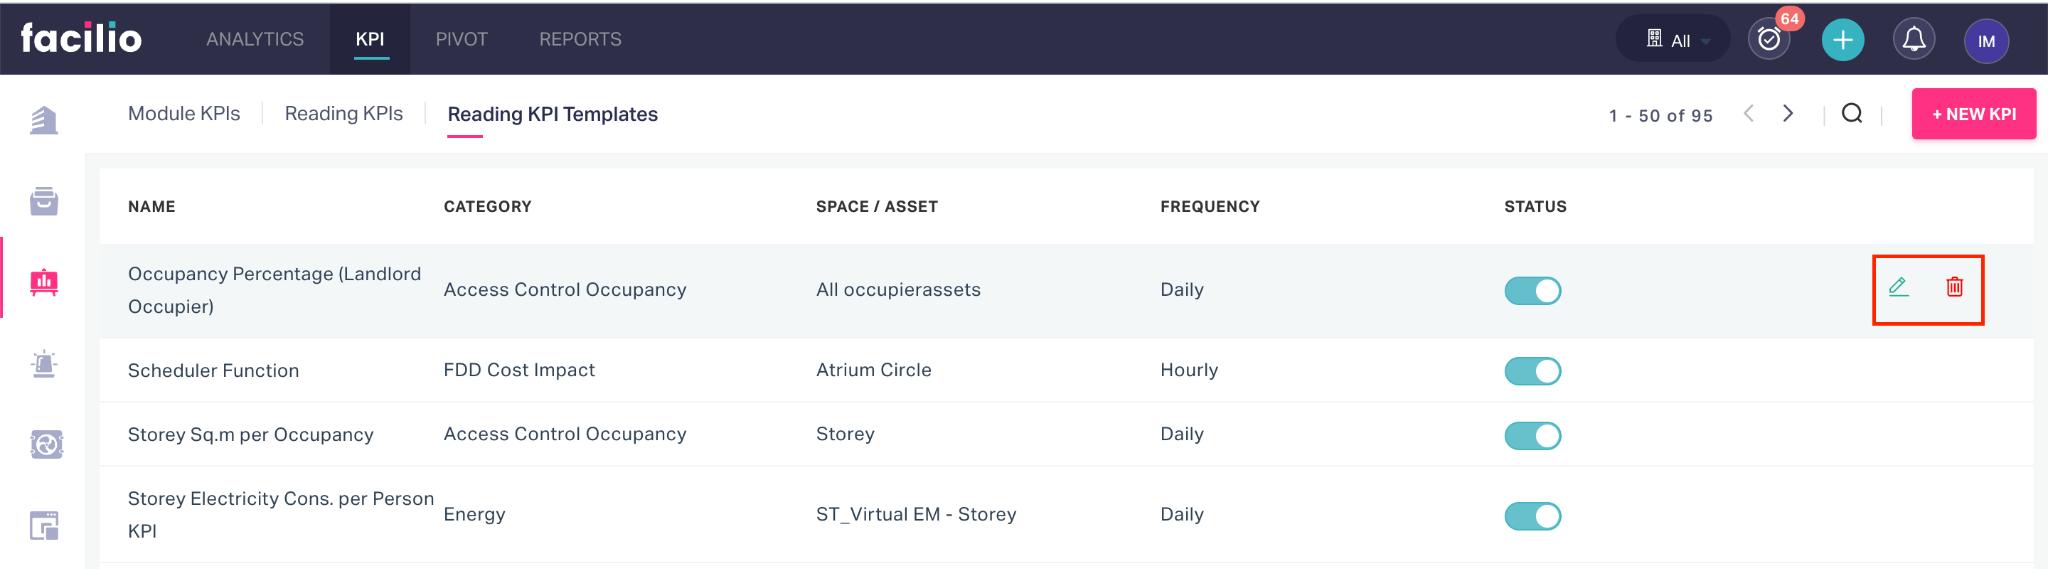
They are,
| Icon | Action/Description |
|---|---|
| To modify the details associated with the KPI | |
| To delete the KPI permanently from the list of KPIs | |
| To enable or disable a KPI item |