Views and Dashboards
The application allows you to create distinct views of data in the dashboard that can be saved and accessed later to view the updated results. You can create views for individual modules and group them into custom folders as required. You can also utilize the system views that are more likely to be accessed and exist in the application by default.
While creating a view you can filter, sort and customize the columns displayed in the dashboard (read the Searching the Application, Sorting Data and Customizing Column Settings sections for more information). You can also schedule email triggers for selected views (read the Scheduling the Export sections for more information). In addition to these, the application facilitates creating card views, pictorial representations and trends of data in the dashboard.
Managing Views
This section explains how to access system views, create a new view, schedule views and, modify and delete the existing views.
Accessing System Views
Click the
 (hamburger) icon at the top left of the dashboard header. The VIEWS panel is displayed as shown below.
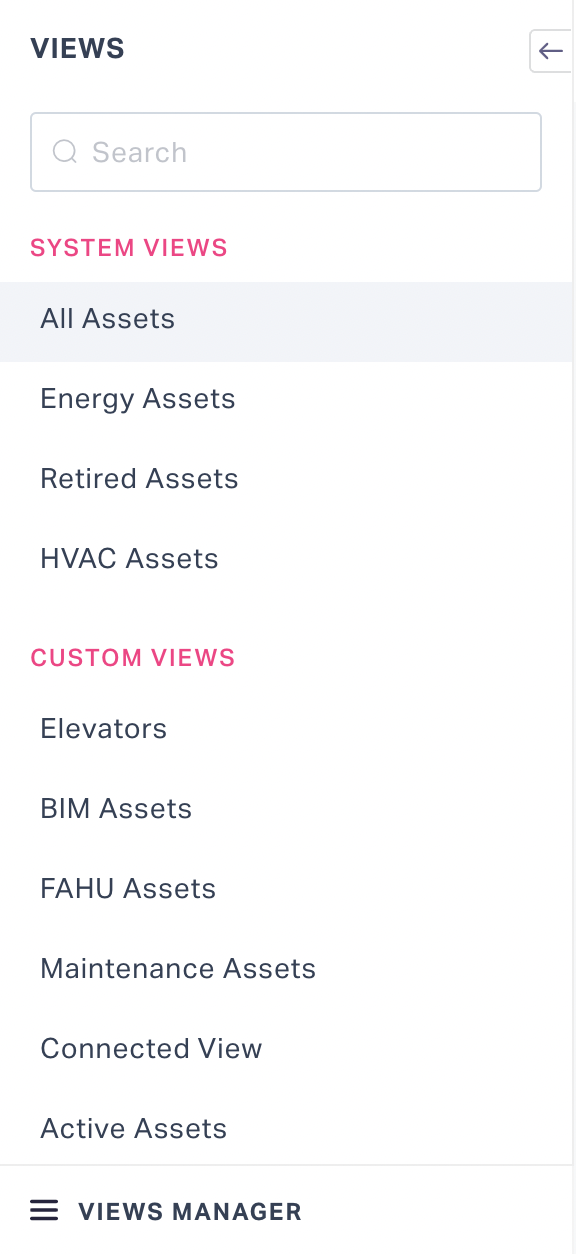
Perform any of the following actions:
- Select a view from the list.
- Start typing some text in the search field and select the required view from the suggestions fetched.
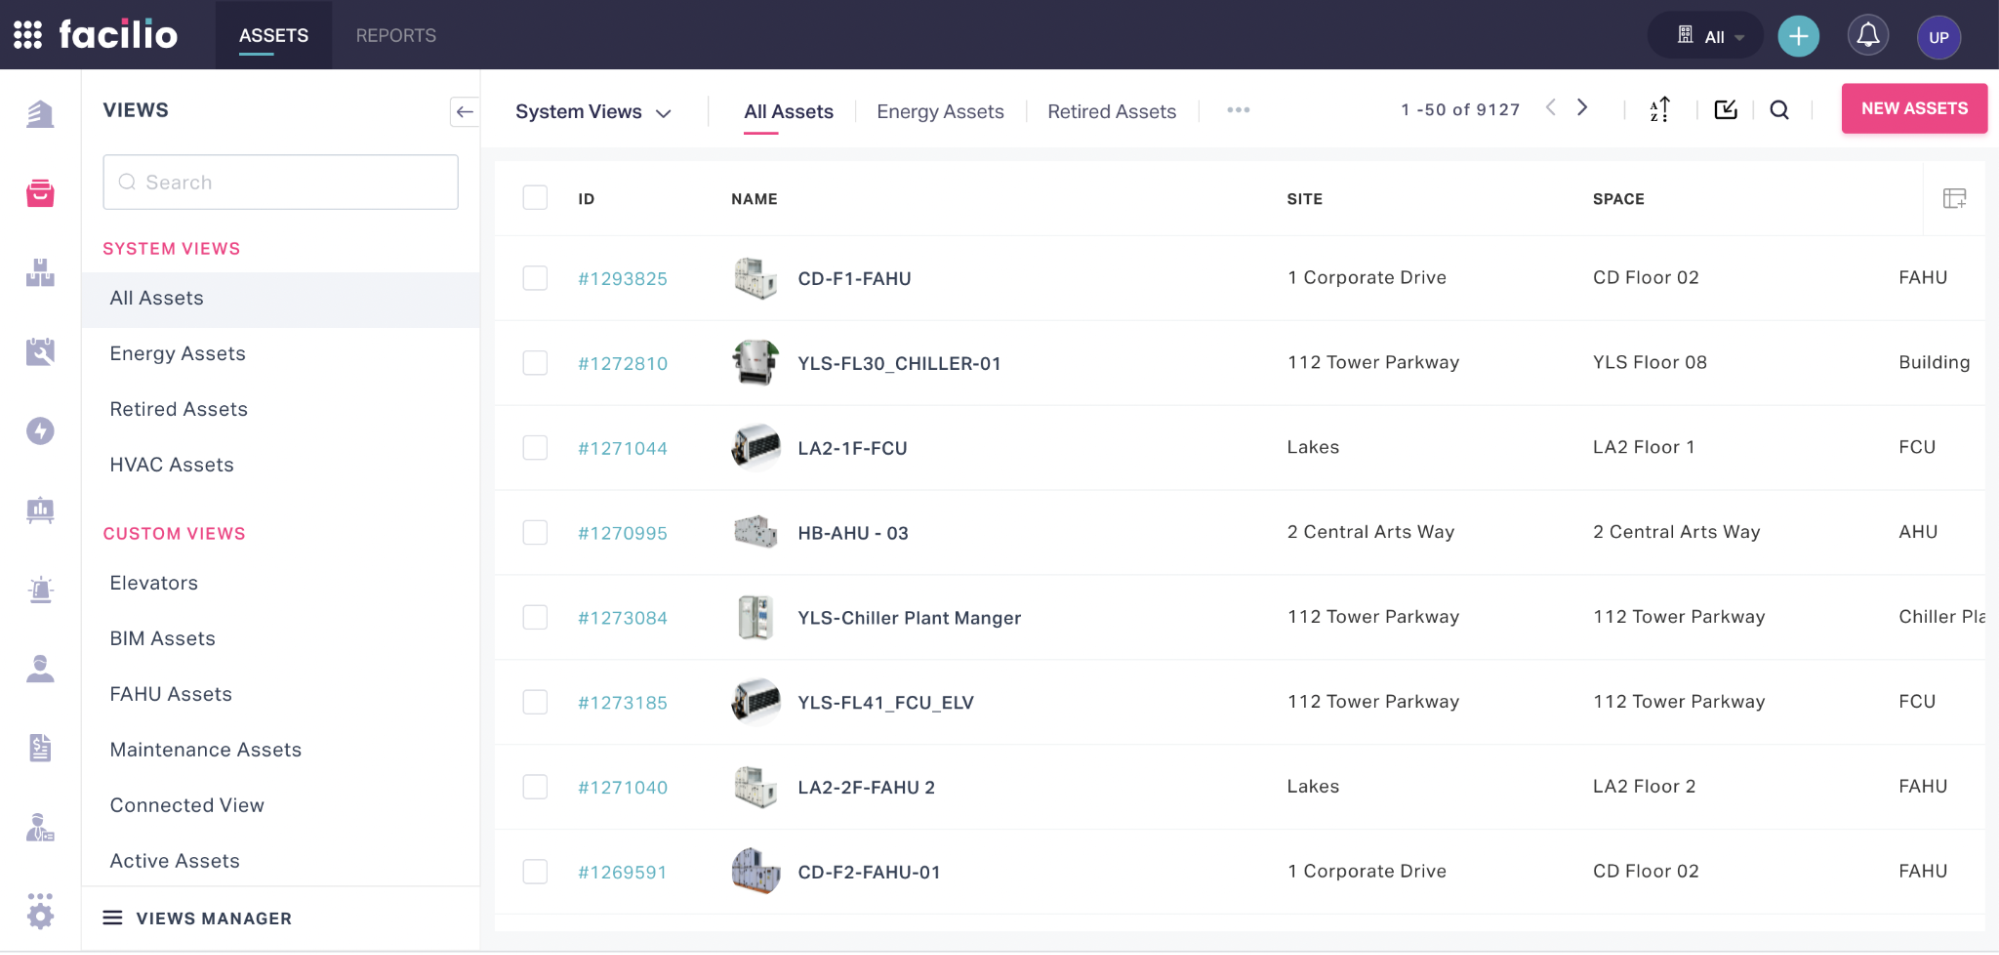
The results are populated in the dashboard.
Example: If you select All Assets, the dashboard will be populated with all the available assets as shown below.
You can also perform the following actions in this screen:
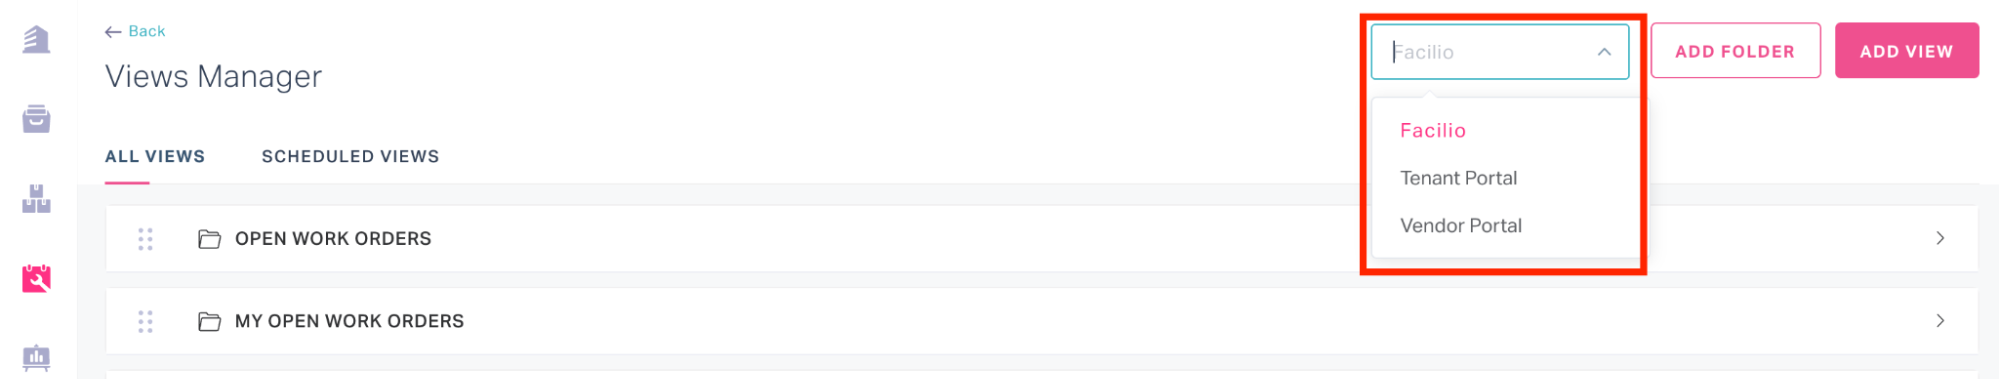
Select the dropdown at the top of the screen to switch the folder. The views in the selected folder will be populated in the dashboard header as shown below.
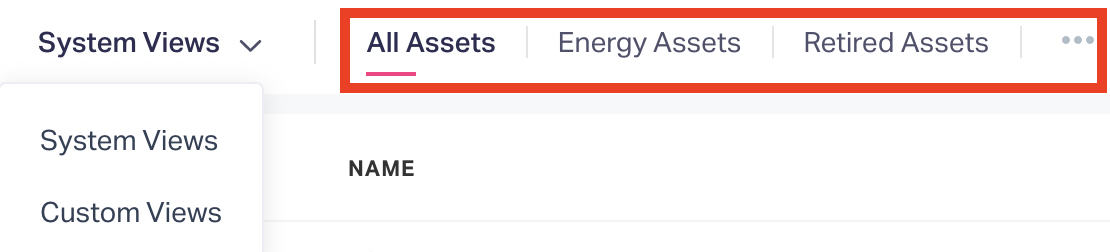
Click the
 (horizontal ellipsis) icon to select the hidden views or rearrange the views displayed in the dashboard header
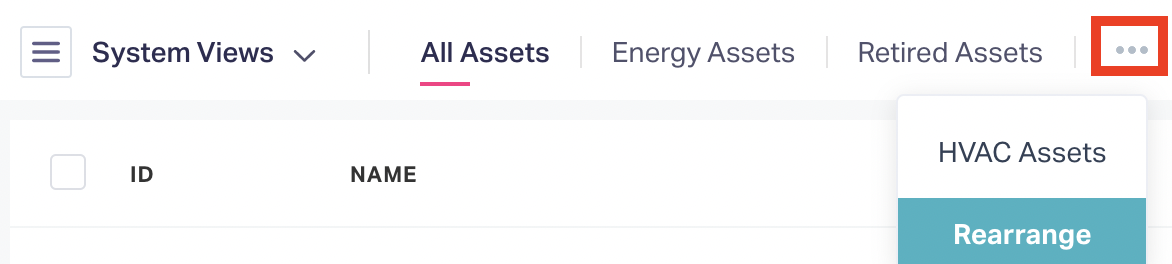
Note: This icon appears if there are more than three views in a folder.
To rearrange the views in a folder,
a. Click the Rearrange option shown in the screenshot above. The View Settings window appears as shown below.
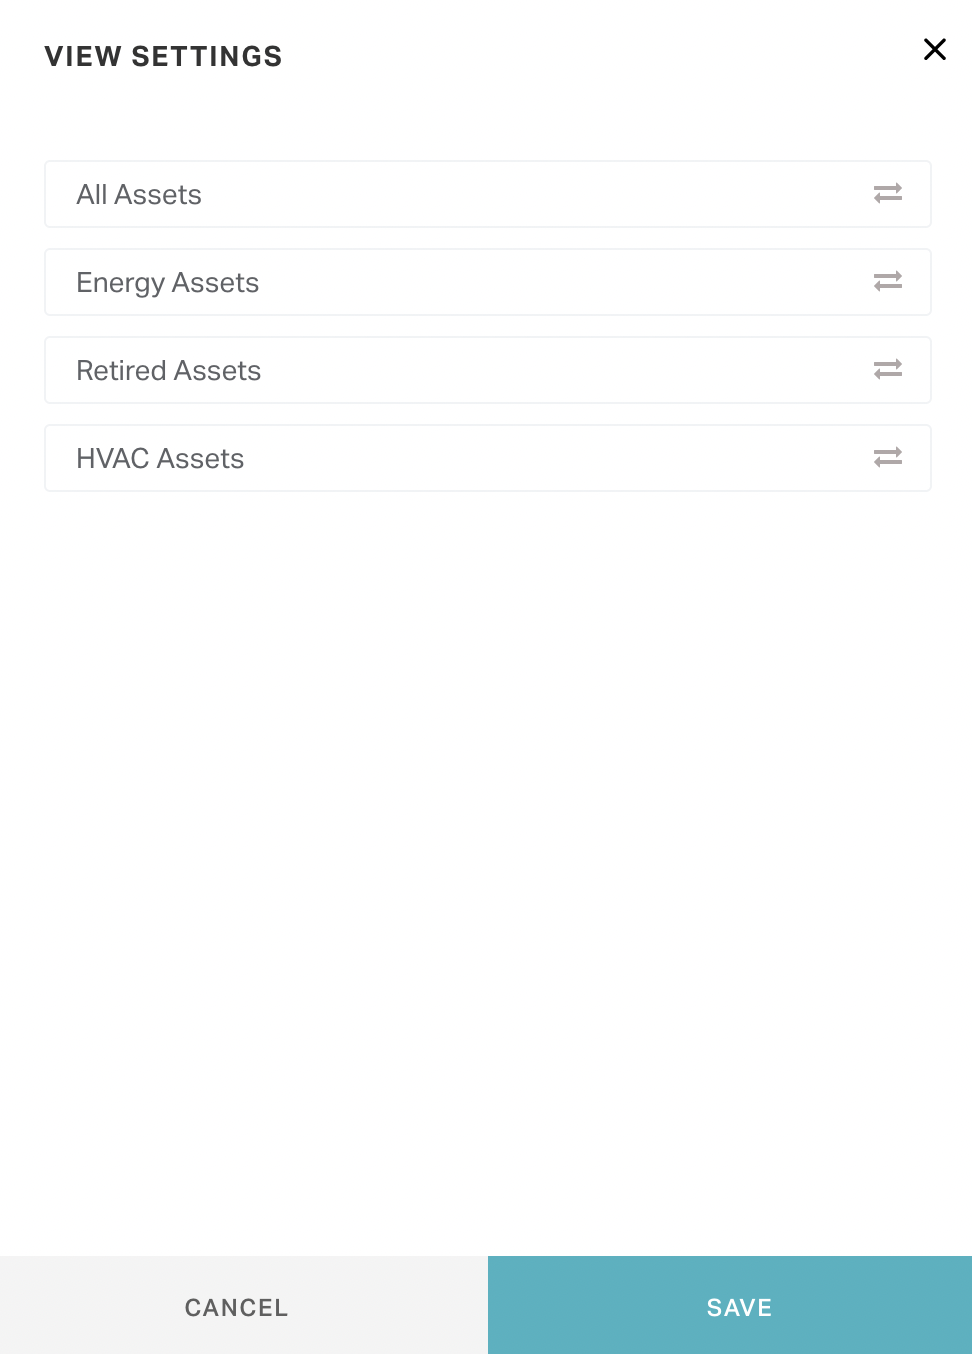
b. Click and drag
 icon corresponding to a view to move it up and down.
c.Click SAVE. The order of the views are updated in the dashboard header as well as the VIEWS panel.
note
You can also rearrange the views in a folder from the Views Manager. Read the Modifying Views section for more information.
Click the
 icon to hide the VIEWS panel.
Creating Views
Select the required module and click the
 (hamburger) icon at the top left of the dashboard header. The VIEWS panel is displayed as shown below.
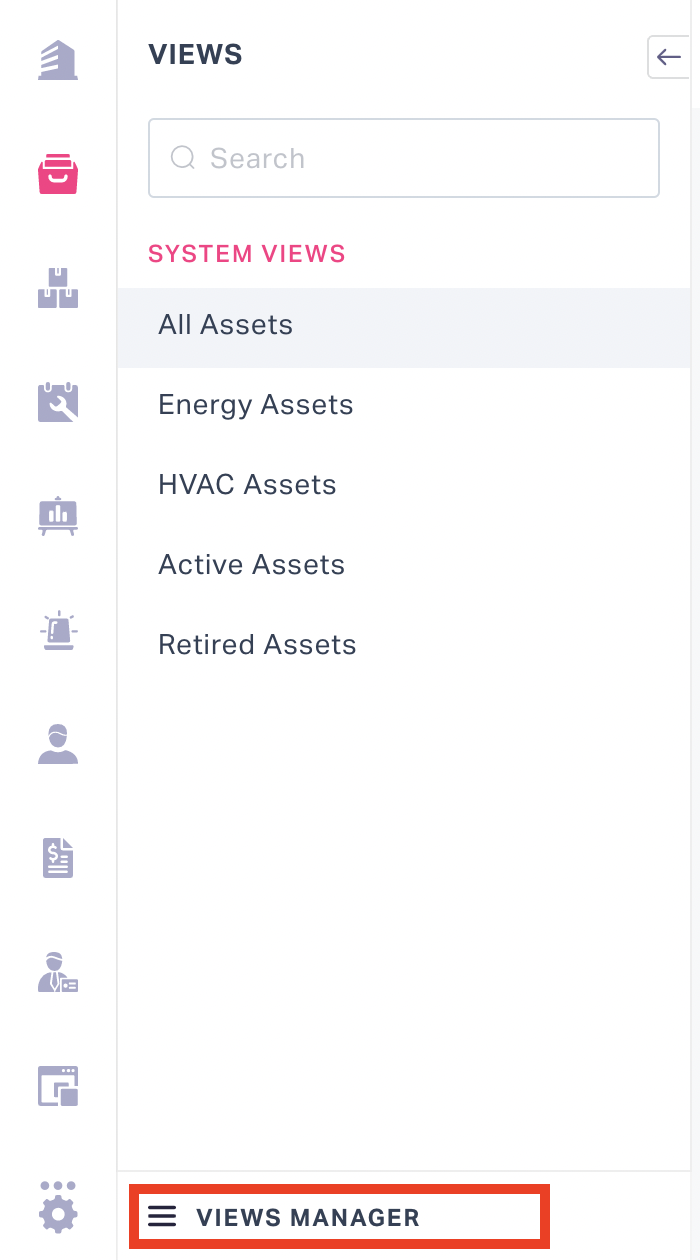
Click the VIEWS MANAGER link at the bottom of the panel. The Views Manager screen appears as shown below.
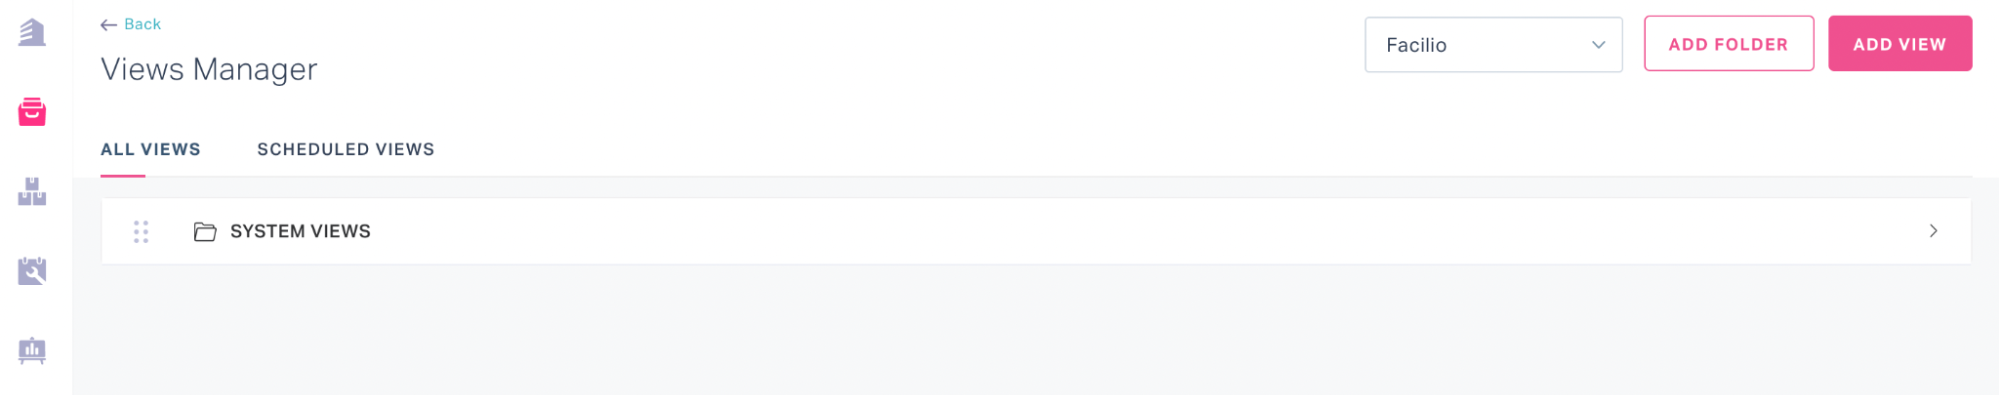
If there are multiple user profiles associated with the account, select the user profile from the dropdown at the top of the screen for which the view has to be created.
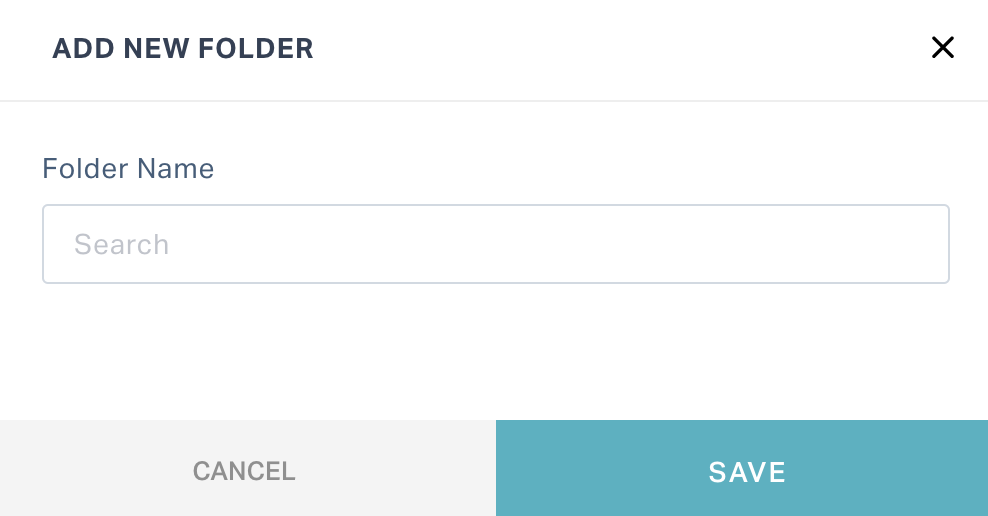
If you want to create a new folder to save the views, click ADD FOLDER.
tip
You can name the folder after the views to be saved in it.
Click ADD VIEW. The SAVE AS NEW VIEW window appears as shown in the screenshot below.
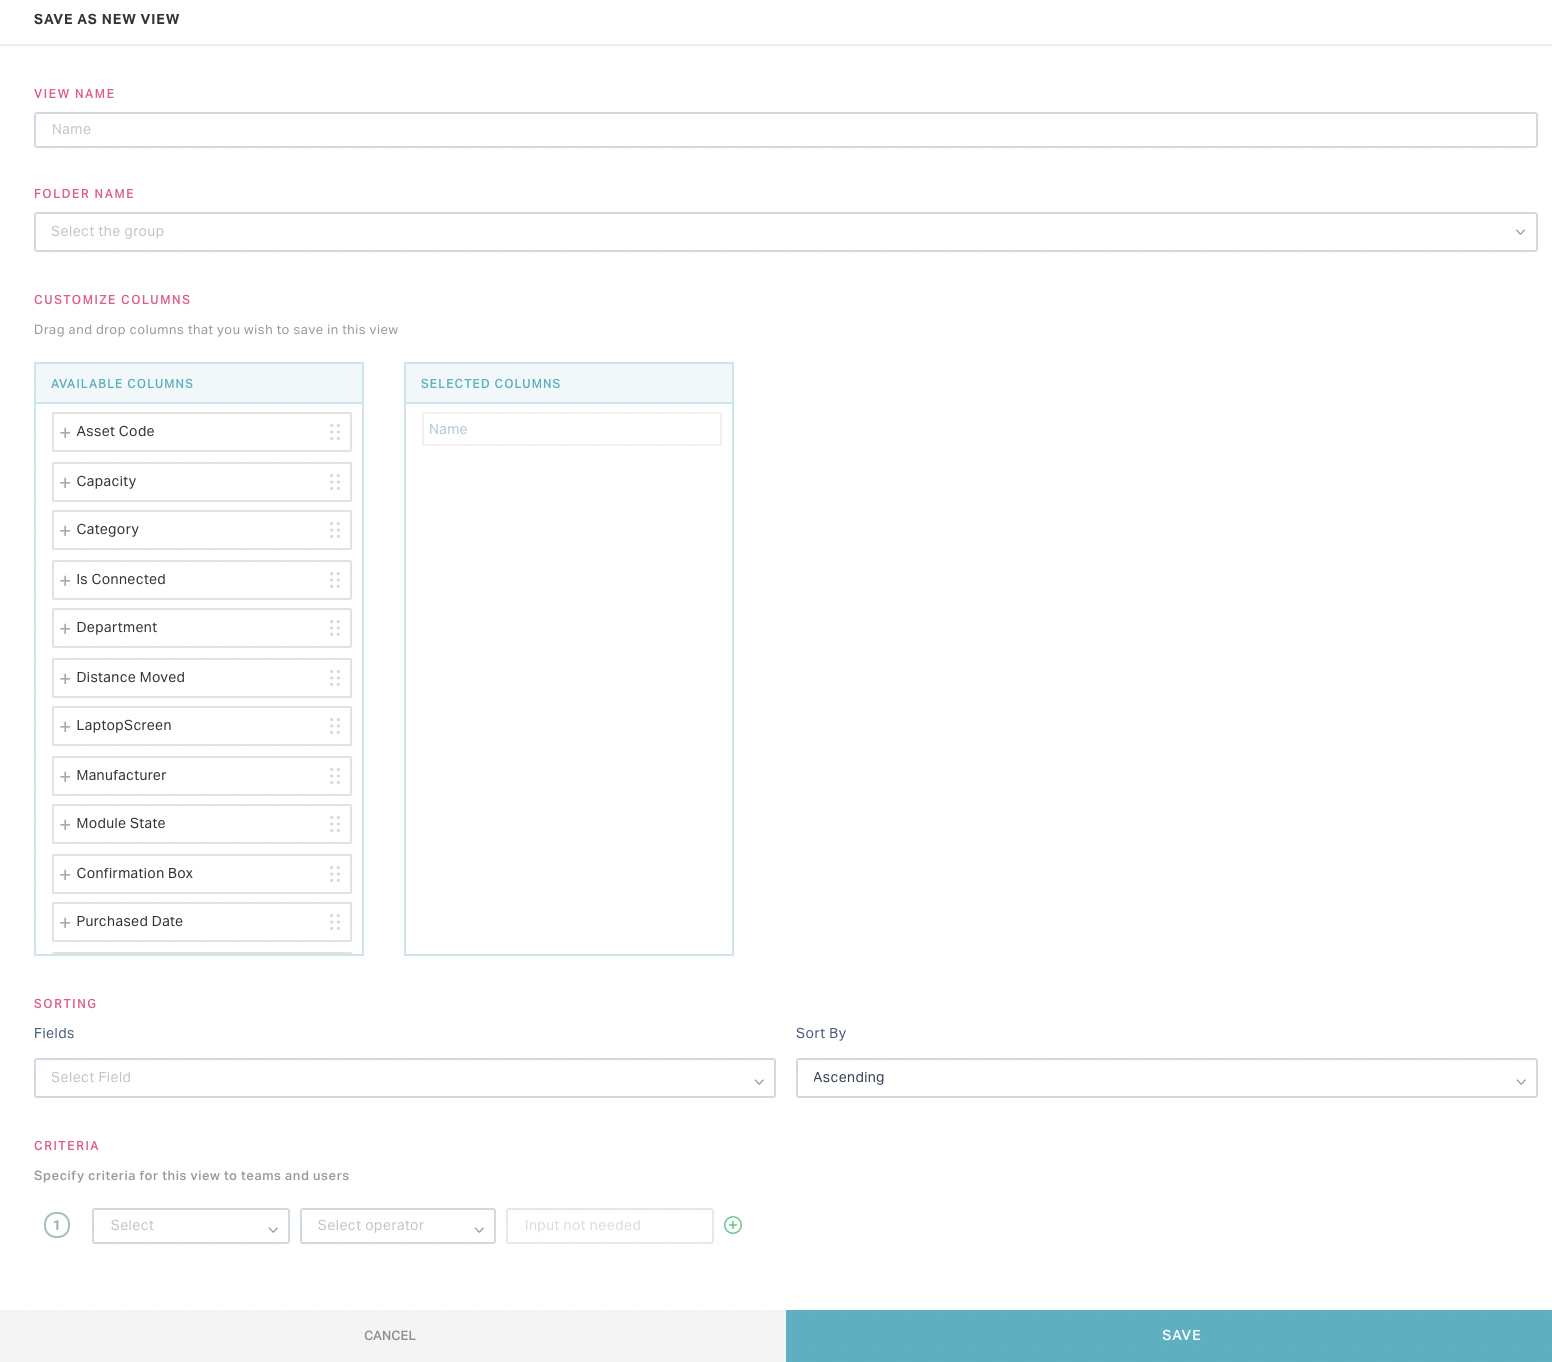
Update the following fields in this screen.
Field Description View Name Create a display name for the new view Folder Name Select the folder in which the view must be saved. Customize Columns Customize the columns that must be displayed in the new view.
Note: Update the SELECTED COLUMNS section corresponding to this field to select the columns to be displayed.Sorting Sort the search results as required. Update the Field to be sorted .You can choose to Sort By either Ascending or Descending order Criteria Specify criteria for the view, that is, update the dropdowns for operand, operator and value. Example: A sample configuration is shown in the screenshot below. Note: This is a multi-value field, that is you can specify multiple criteria (using  ) for a view. Also, you can choose any of the following options:
- Match All - Returns the entities that comply with all specified criteria
- Match Any - Returns the entities that comply with at least one criterion
Click SAVE. The view is now saved in the selected folder.
note
You can also save a search result as a new view. Read the Saving Search Results as a View section for more information.
Modifying Views
Select the required module and click the
(hamburger) icon at the top left of the dashboard header. The VIEWS panel is displayed as shown below.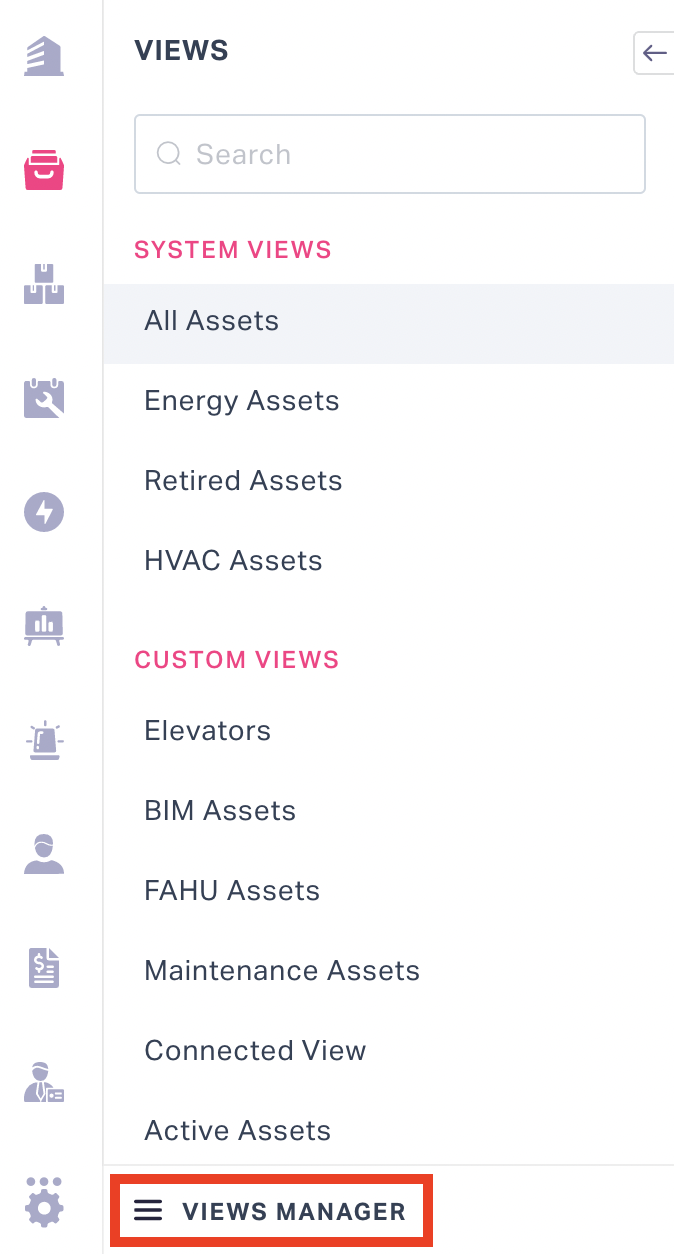
Click the VIEWS MANAGER link at the bottom of the panel. The Views Manager screen appears as shown below.
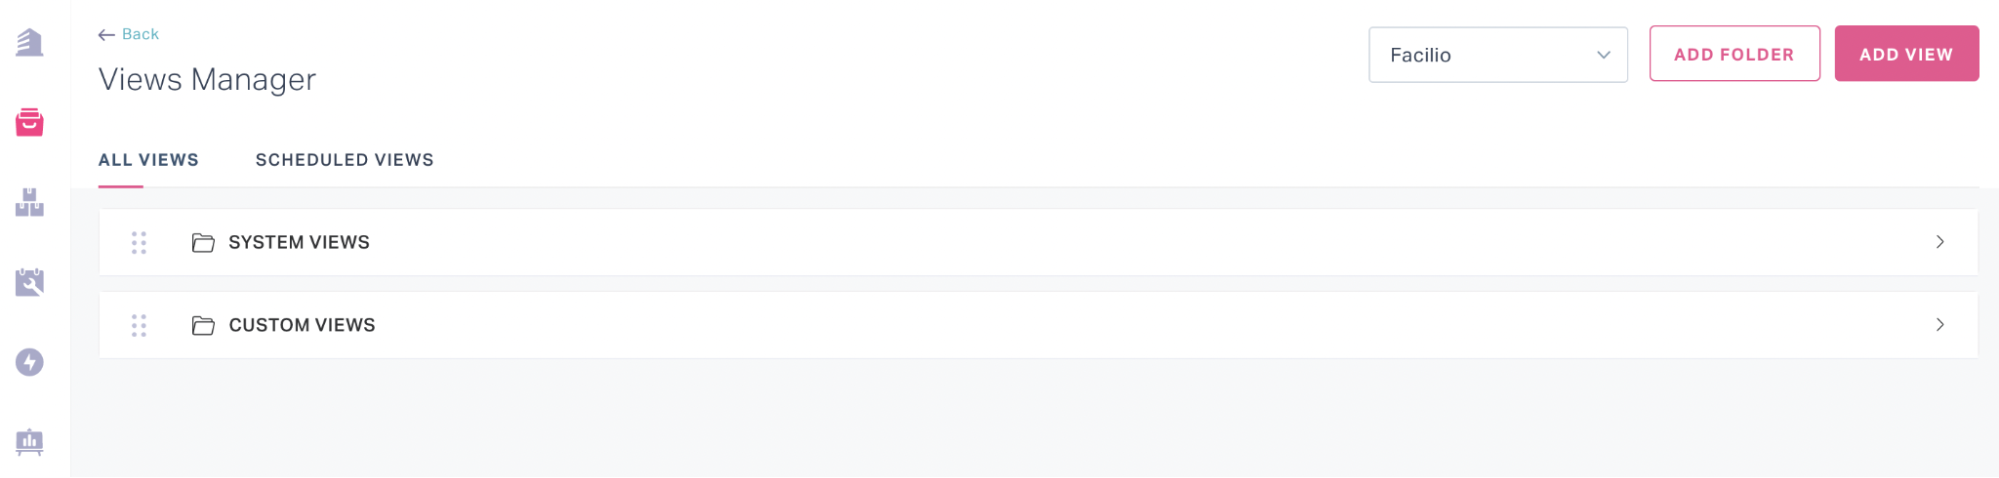
Note: The ALL VIEWS section is displayed by default.
If there are multiple user profiles associated with the account, select an user profile from the dropdown at the top of the screen to filter the corresponding folders.
Perform the required modifications to the existing views. The scope of modifications are listed below:
Click and drag
 icon corresponding to the folders or associated views to reposition them, respectively.
note
You can also rearrange the views in a folder from the dashboard header using the Rearrange option (refer to the rearrangement steps in the Accessing System Views section for more information).
Click the
 (edit) icon corresponding to the folder to rename it.
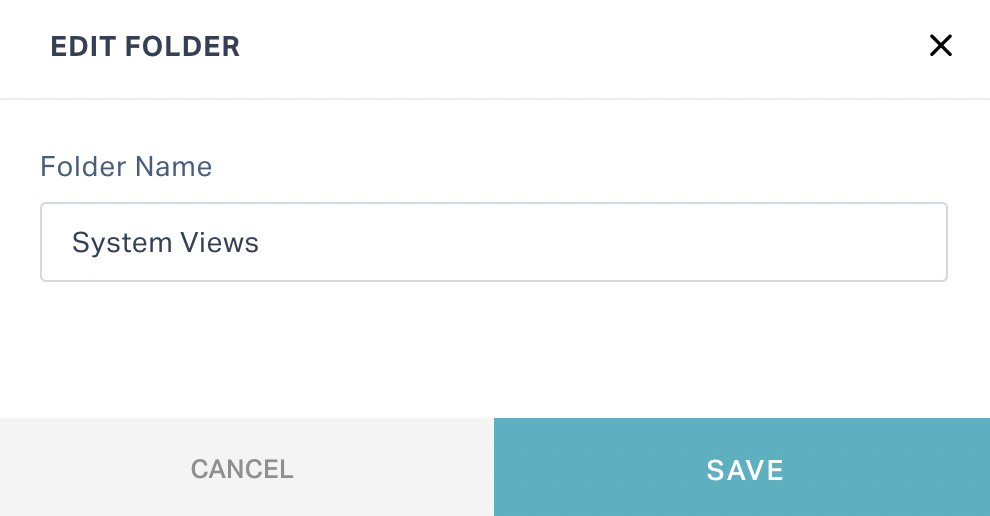
Click the
(edit) icon corresponding to the view to modify the name and other components (for example, folder, displayed columns and so on) associated with it (refer to Point no.4 in the Creating New Views section for more information on components of a view).Click the
 (share) icon corresponding to the view to control who can access the view.
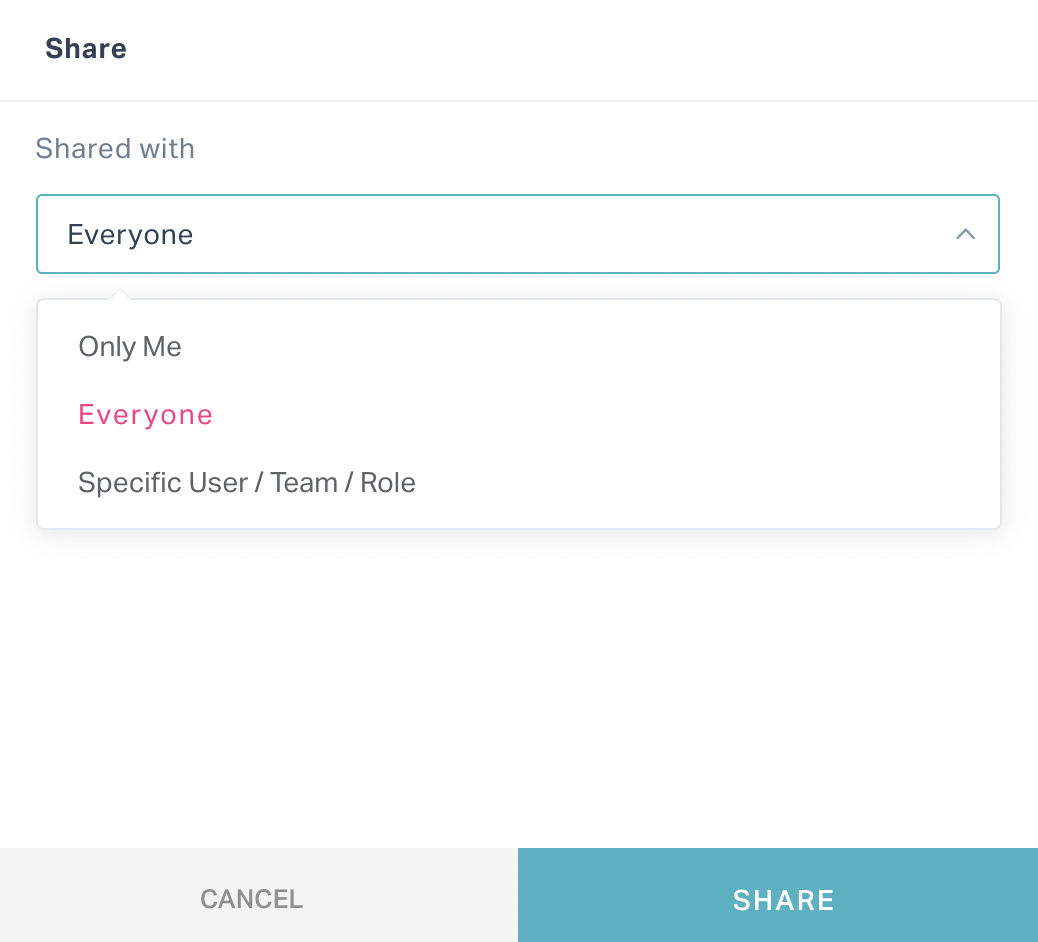
Note: All views are shared with everyone by default.
- Click
 at the top left to navigate to the previous screen. The VIEWS panel is now updated with the modified views.
Deleting Views
Select the required module and click the
(hamburger) icon at the top left of the dashboard header. The VIEWS panel is displayed as shown below.Click the VIEWS MANAGER link at the bottom of the panel. The Views Manager screen appears as shown below.
Note: The ALL VIEWS section is displayed by default.
If there are multiple user profiles associated with the account, select an user profile from the dropdown at the top of the screen to filter the corresponding folders
Click the folder to display the available views in it.
Click the
 icon corresponding to the required view to delete it. The Delete View window appears as shown below.
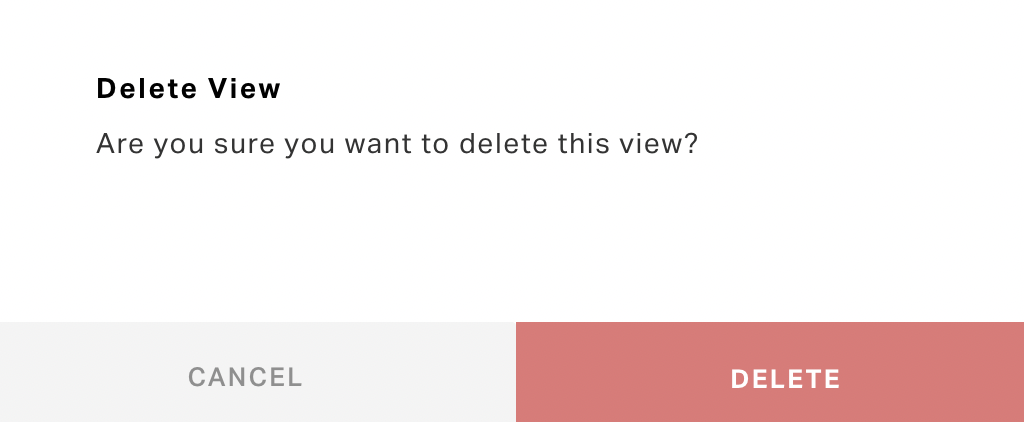
Click DELETE. The view is deleted from the folder.
Click
at the top left to navigate to the previous screen. The deleted view is now removed from the VIEWS panel.
note
You cannot delete the default system views, that is, the views in the System Views folder. Also, you cannot directly delete a folder that contains views in it. The ![]() icon will be displayed only for empty folders.
icon will be displayed only for empty folders.
Scheduling Views
Select the required module and click the
(hamburger) icon at the top left of the dashboard header. The VIEWS panel is displayed as shown below.Click the VIEWS MANAGER link at the bottom of the panel. The Views Manager screen appears as shown below.
Note: The ALL VIEWS section is displayed by default.
Navigate to the SCHEDULED VIEWS section. The list of scheduled reports are displayed.
Click SCHEDULE VIEW at the top right of this screen.
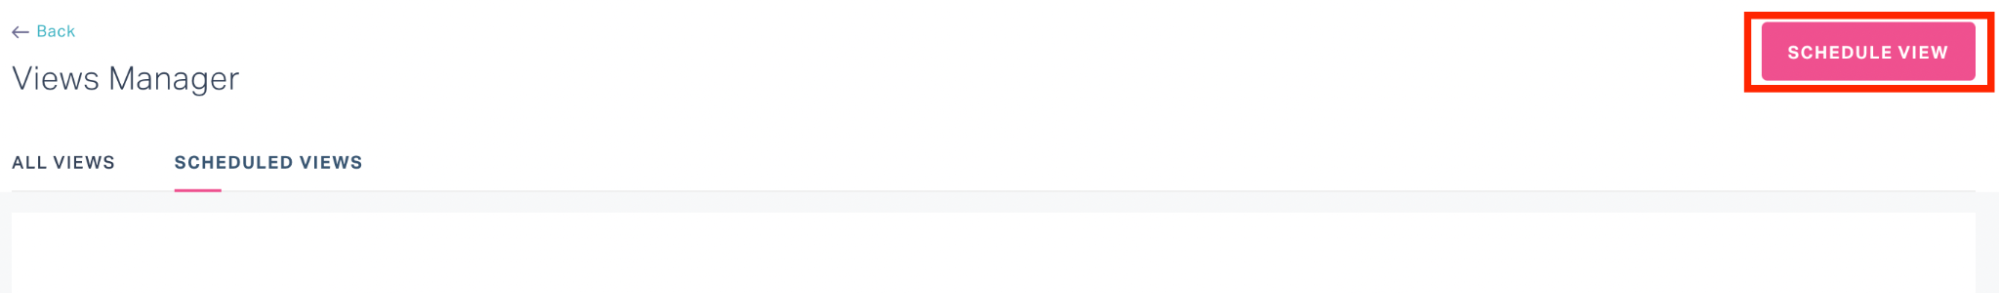
The SCHEDULE THIS VIEW window appears as shown below.
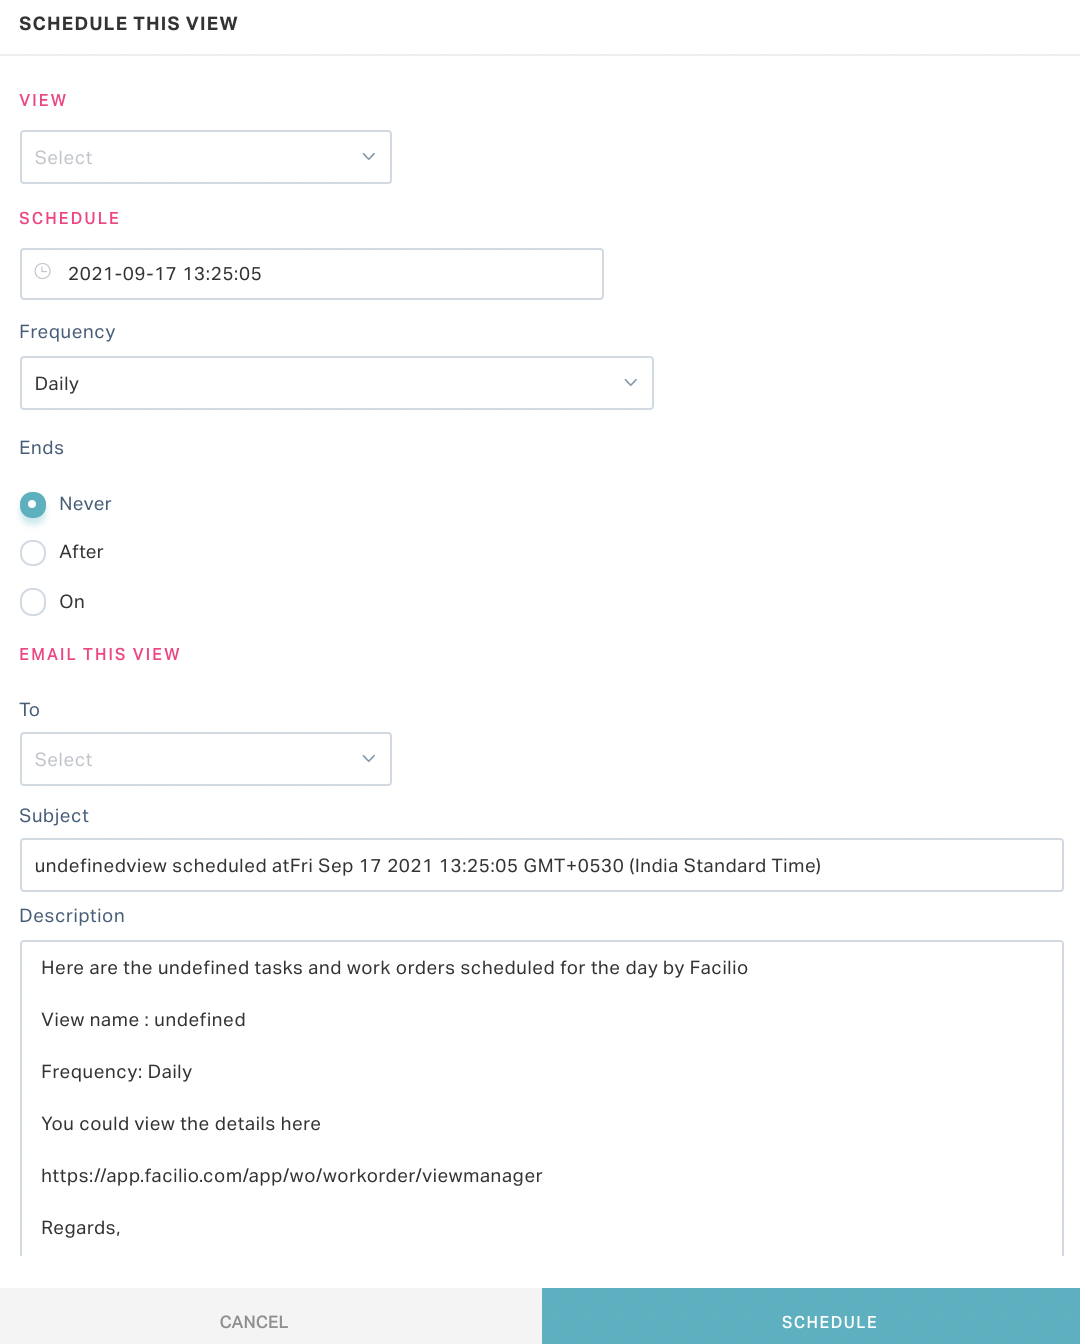
Update the following fields in this screen.
Section Filed Description VIEW View The report (view) to be scheduled. Select a report from the dropdown. SCHEDULE Date & Time The date and time at which the report has to be triggered Frequency The frequency of the email trigger. You can choose from the following options: - Daily
- Weekly
- Monthly
- Yearly
Ends Recurrence of the email trigger. You can choose from the following options: - Never - Recurring event with respect to the frequency selected
- After - Number of recurrences (for example, 3 times)
- On - Date of occurrence
EMAIL To Recipients' email address THIS VIEW Subject Subject of the email to be sent.
Note: This field will be auto-populated based on the report selected and the details updated in the above fields.Description Content of the email to be sent.
Note: This field will be auto-populated based on the report selected and the details updated in the above fields.Click SCHEDULE. An email is triggered to the recipient(s) with the updated report on the scheduled date and time in scheduled frequency.
note
You can also schedule reports using the Export ( ![]() ) option in the dashboard header. Read the Scheduling Reports section for more information.
) option in the dashboard header. Read the Scheduling Reports section for more information.
Managing Dashboard
This section explains how to access the dashboards, create card views, pictorial representations and trends of data in the dashboard, configure new tabs, filters and timelines, and work with the widgets and dashboards.
Accessing Dashboards
To access the available dashboards,
Click the
 (dashboard) icon and then click the (hamburger) icon at the top left of the dashboard header. The DASHBOARDS panel is displayed as shown below.
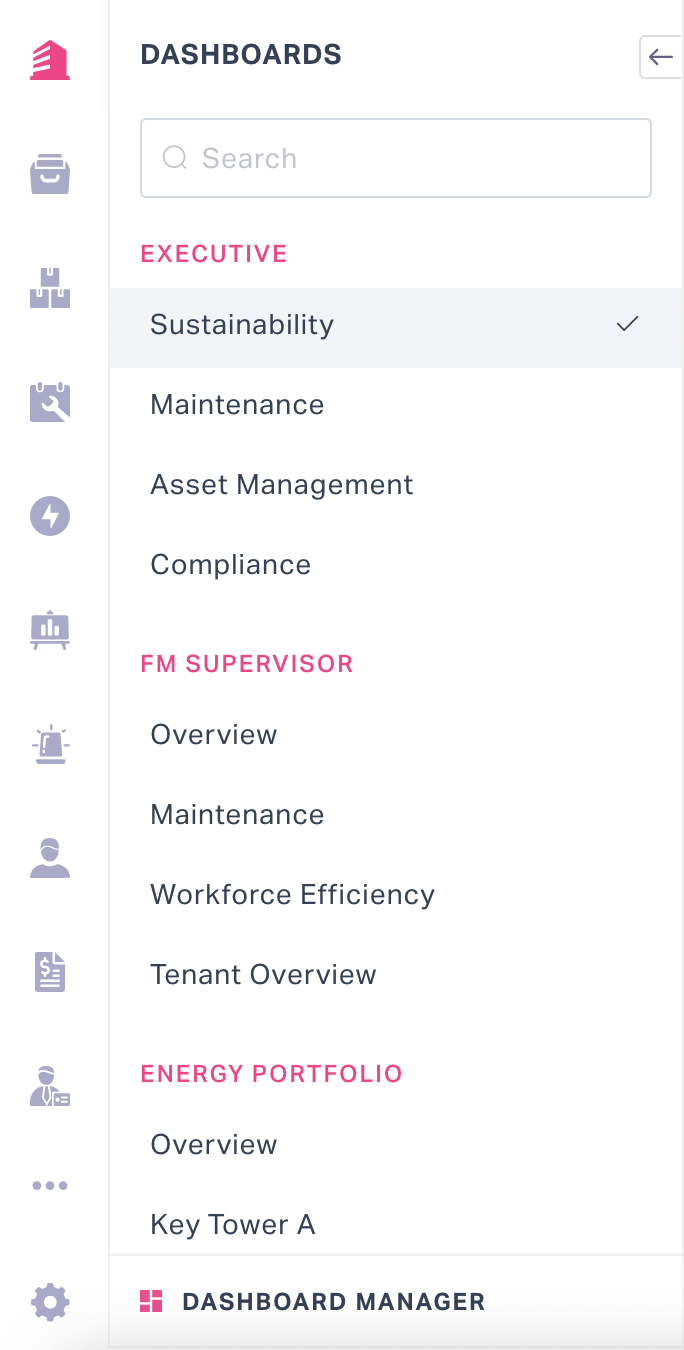
Perform any of the following actions:
- Select a dashboard from the list.
- Start typing some text in the search field and select the required dashboard from the suggestions fetched.
The results are populated in the dashboard.
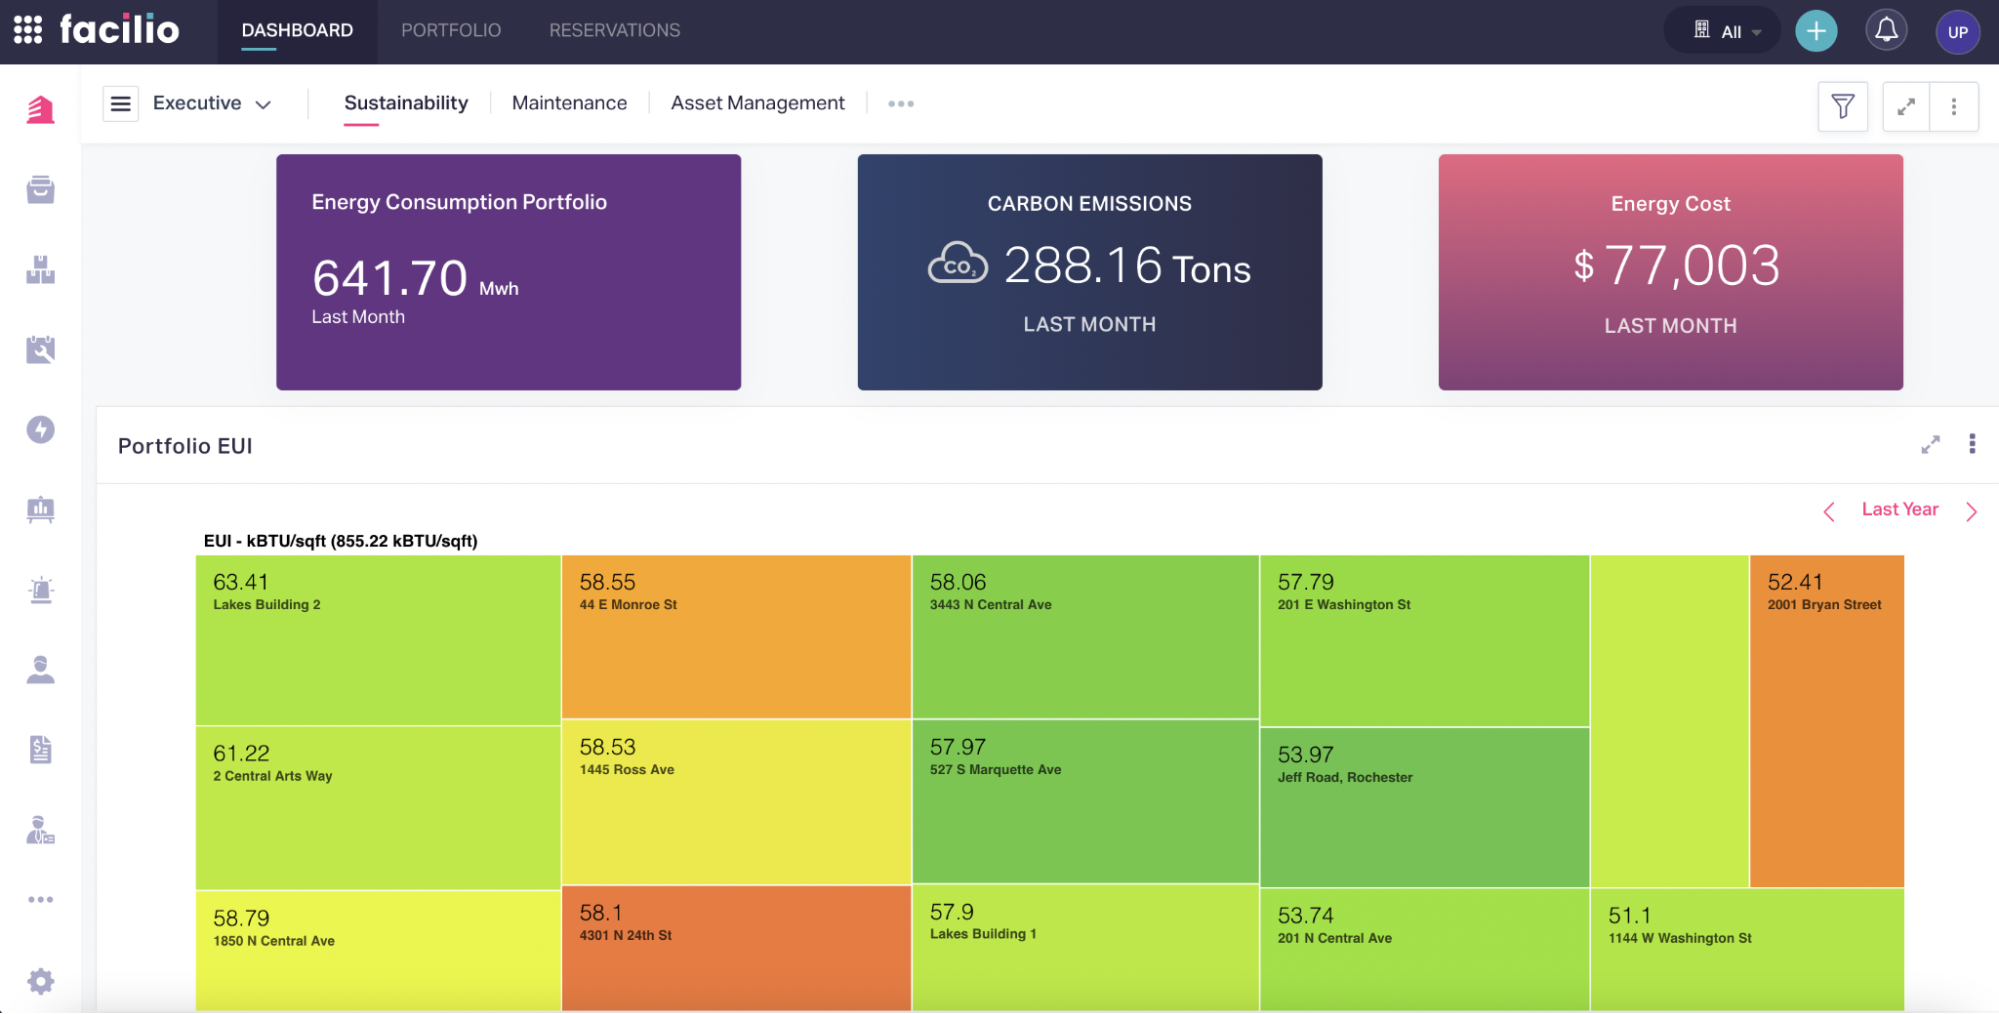
Example: If you select Sustainability, the dashboard will be populated with the configured widgets as shown below.
Alternatively, you can click the
 (link) icon corresponding to the dashboard in the Dashboard Manager to view it.
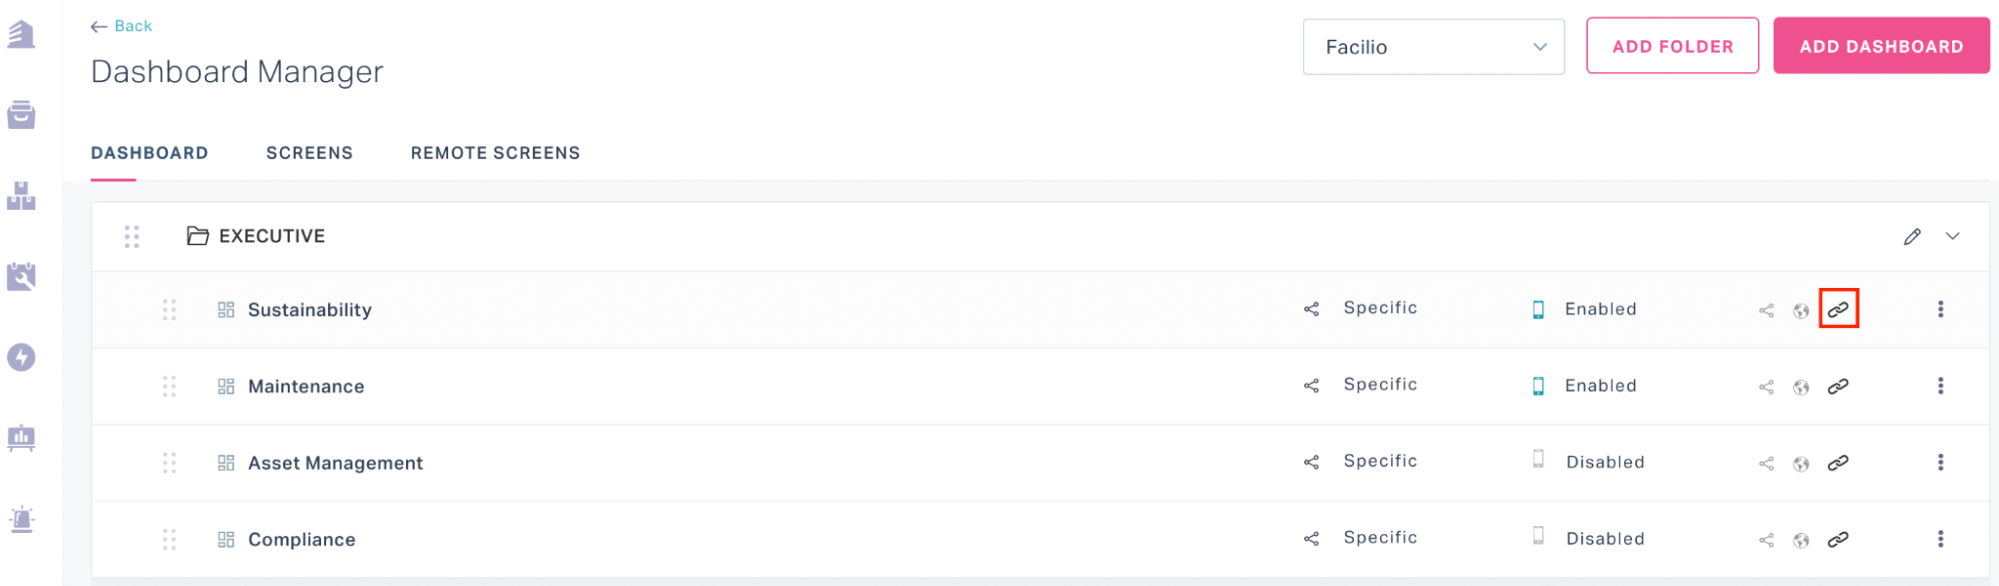
You can also perform the following actions in this screen:
Select the dropdown at the top of the screen to switch the folder. The dashboards in the selected folder will be populated in the dashboard header as shown below
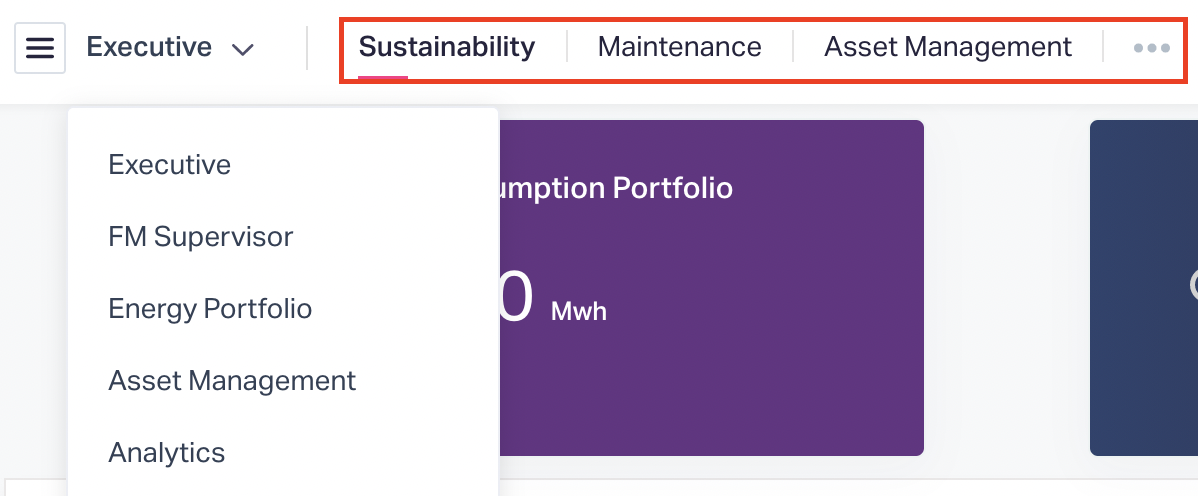
Click the
(horizontal ellipsis) in the dashboard header icon to display the hidden dashboards.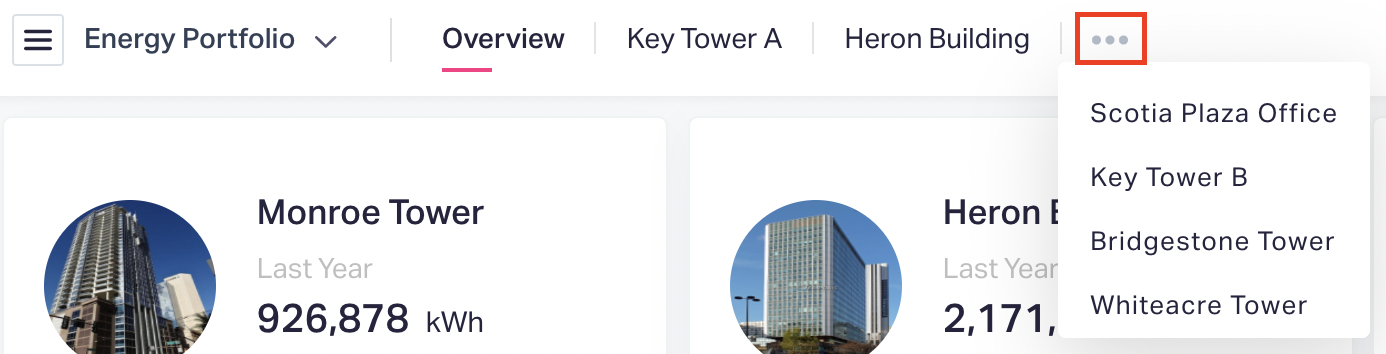
Note: This icon appears if there are more than three dashboards in a folder. You can rearrange the views in a folder from the Dashboard Manager. Read the Modifying Views section for more information.
Click the
 (Fullscreen) icon to view the dashboard in full screen mode.
Click the
 (vertical ellipsis) icon at the top right of the dashboard and select Download to download the contents of the dashboard in PDF format.
Click the
icon to hide the DASHBOARDS panel.
Creating Dashboards
Click the
(dashboard) icon and then click the (hamburger) icon at the top left of the dashboard header. The DASHBOARDS panel is displayed as shown below.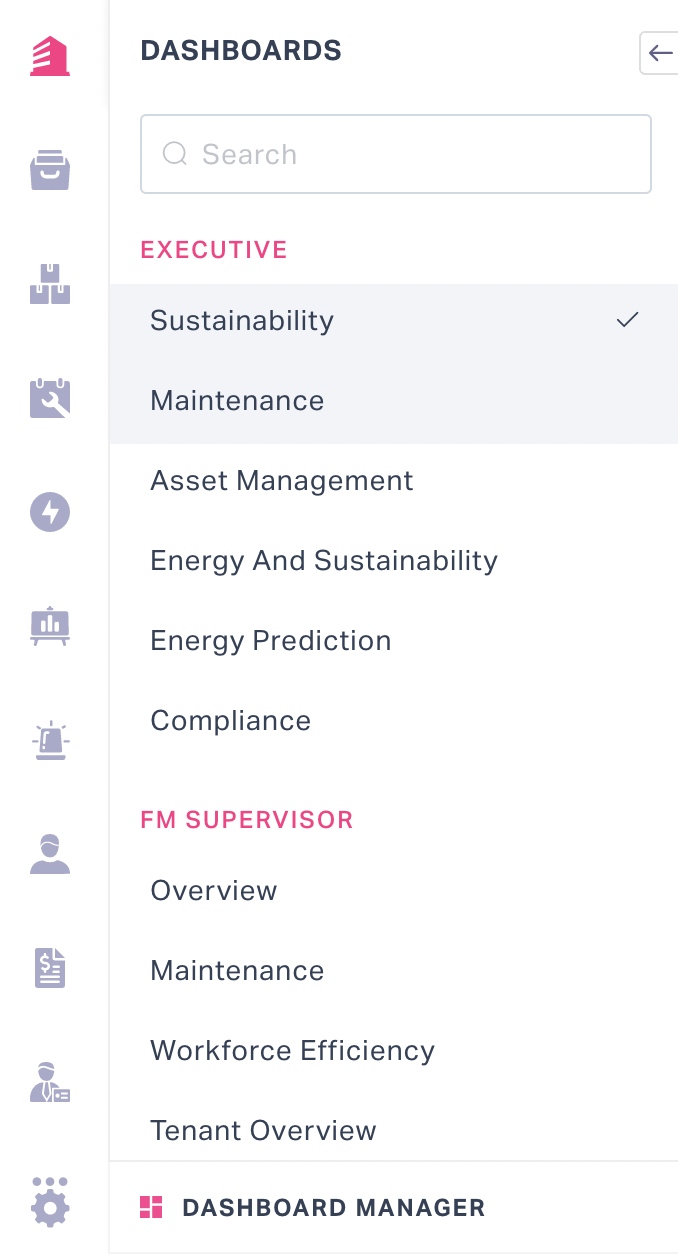
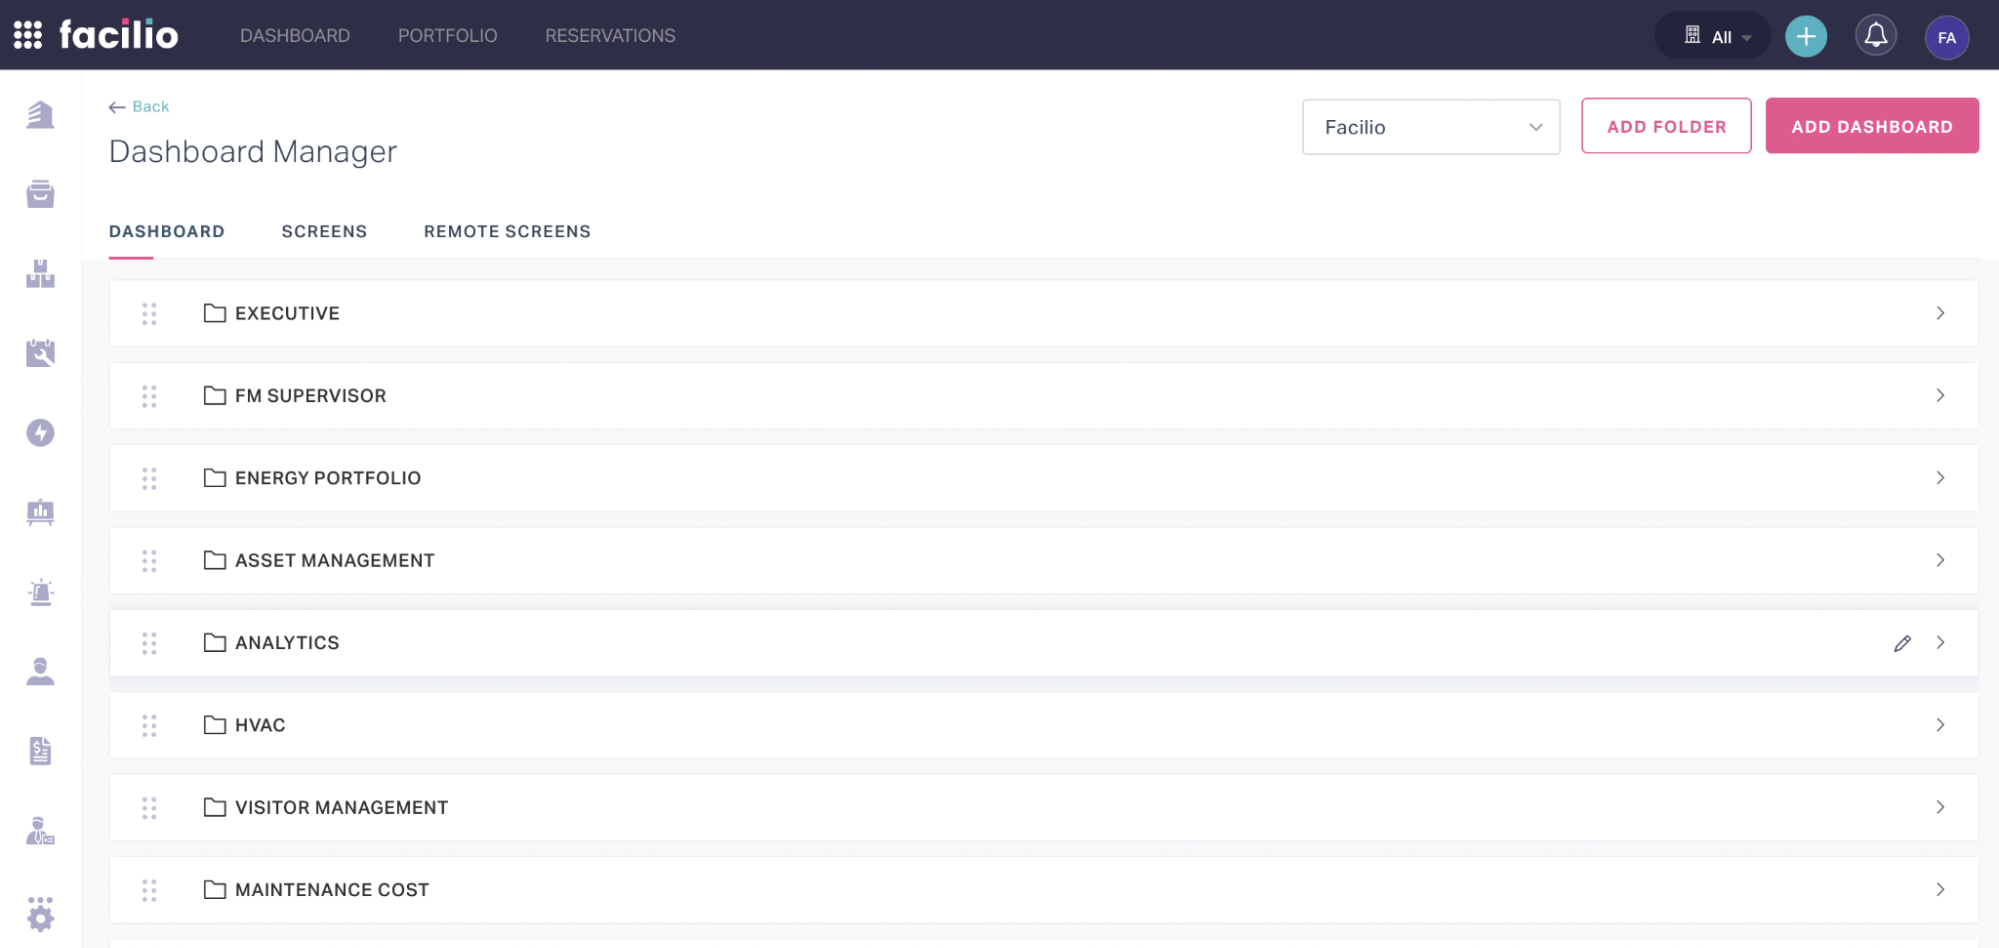
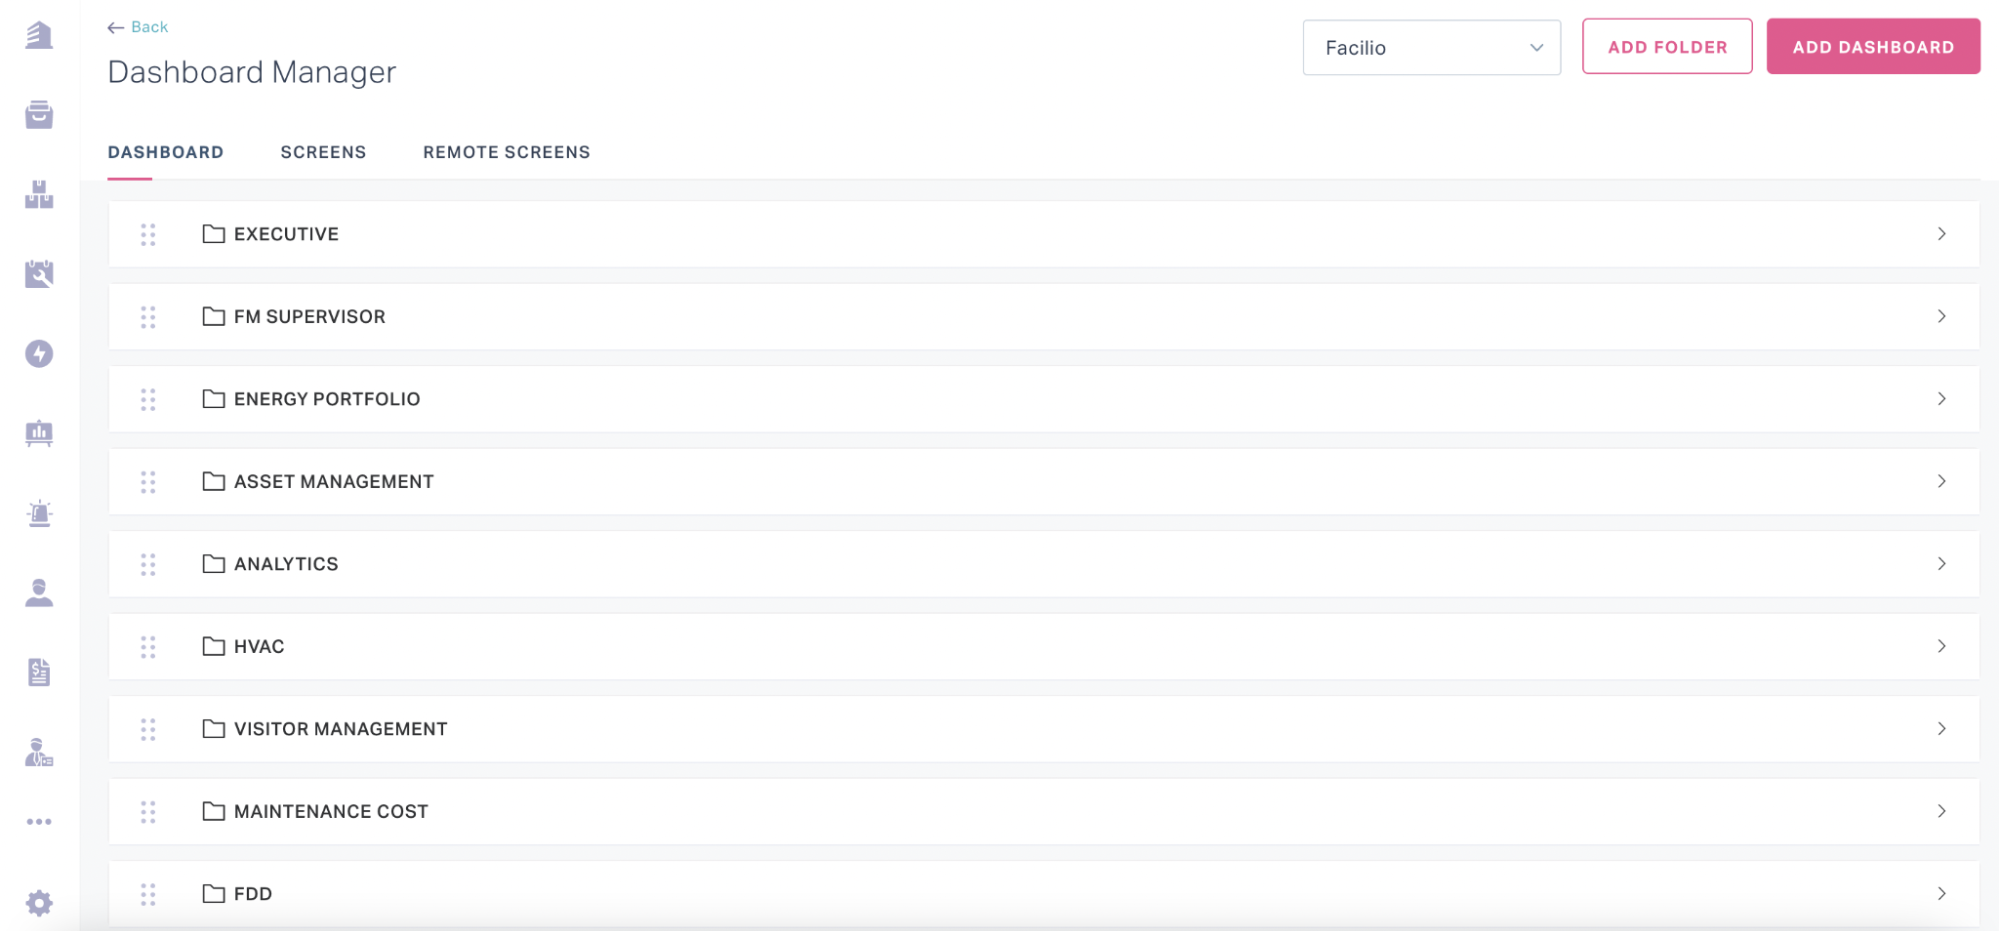
Click the DASHBOARD MANAGER link at the bottom of the panel. The Dashboard Manager screen appears as shown below (The DASHBOARD section is displayed by default).
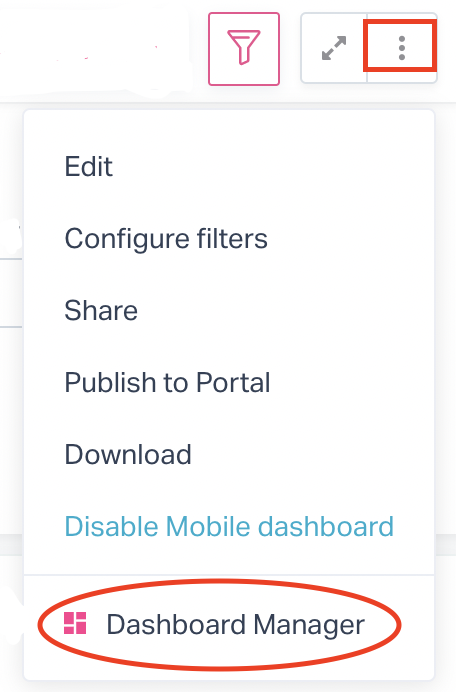
Note: Alternatively, you can access the Dashboard Manager upon clicking the (vertical ellipsis) icon at the top right of the dashboard.
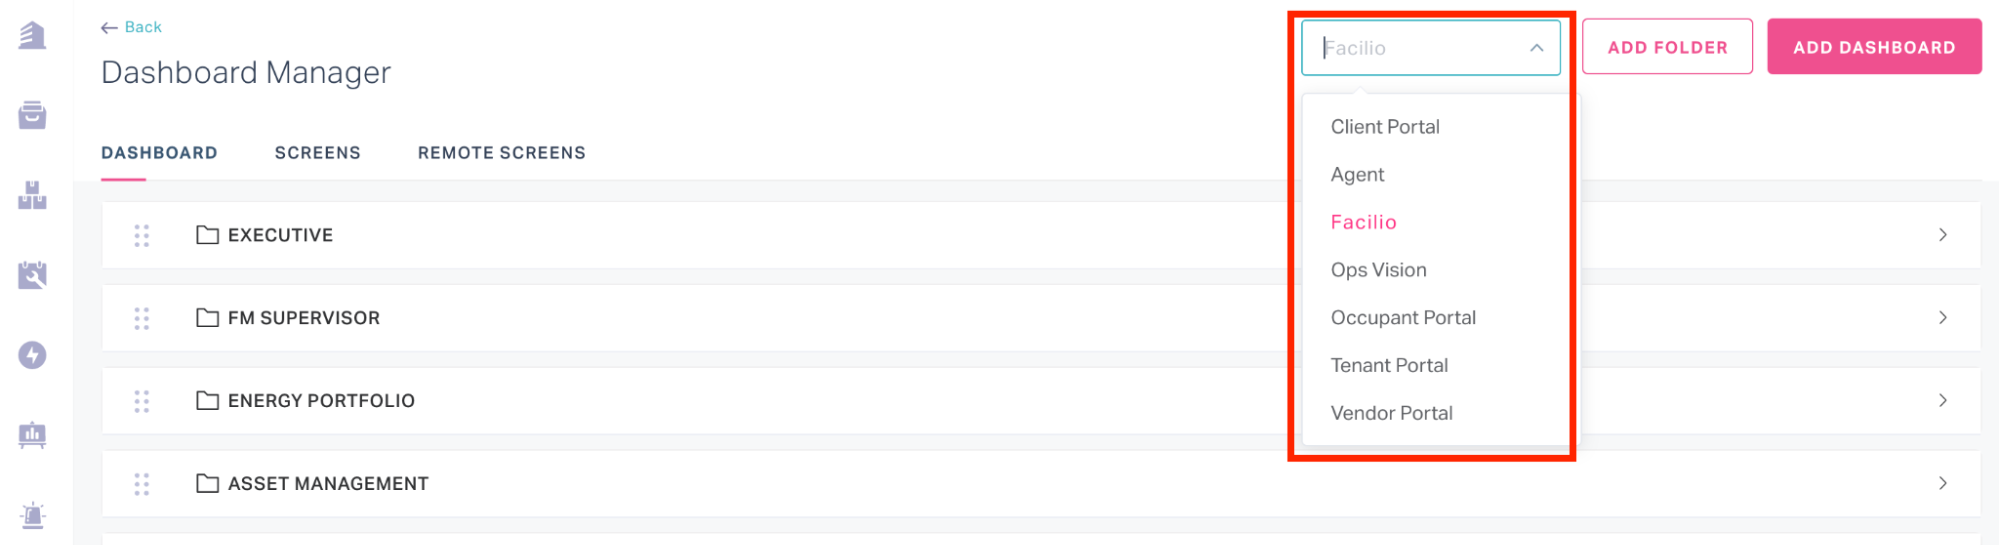
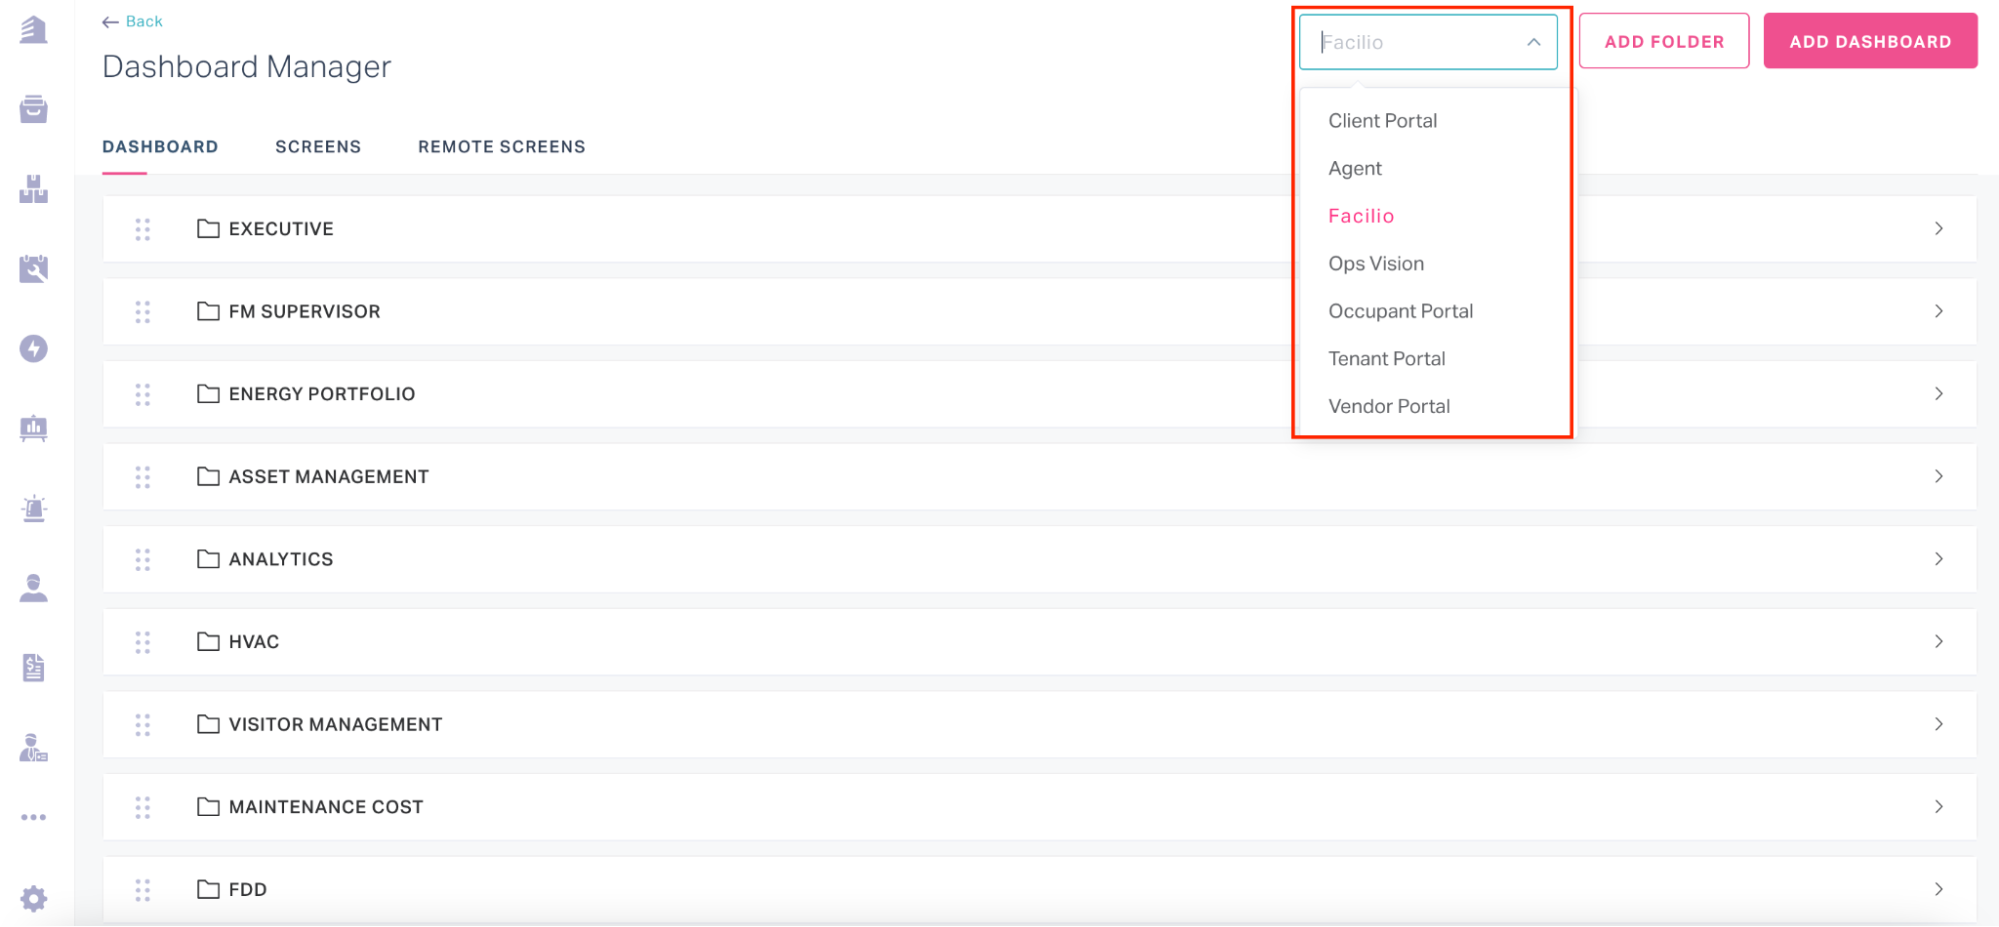
If there are multiple user profiles associated with the account, select the user profile from the dropdown at the top of the screen for which the dashboard has to be created.
If you want to create a new folder to save the dashboard views, click ADD FOLDER
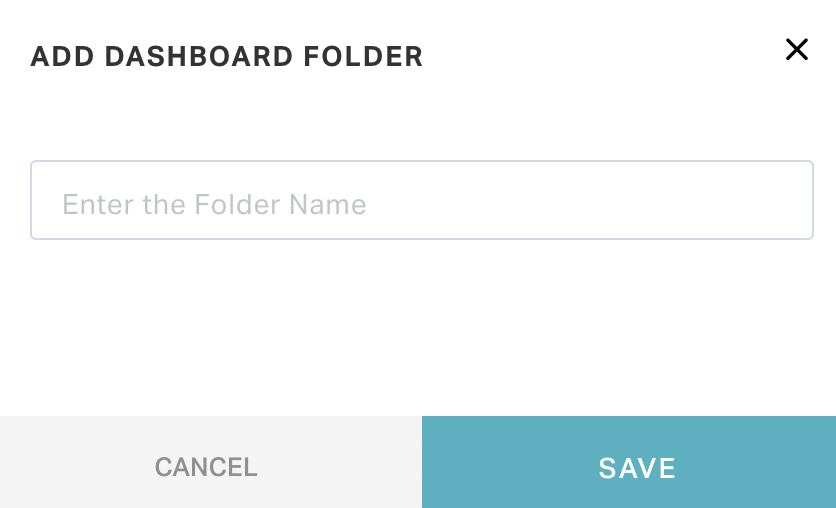
tip
You can name the folder after the dashboards to be saved in it.
Click ADD DASHBOARD. A new screen appears as shown in the screenshot below.
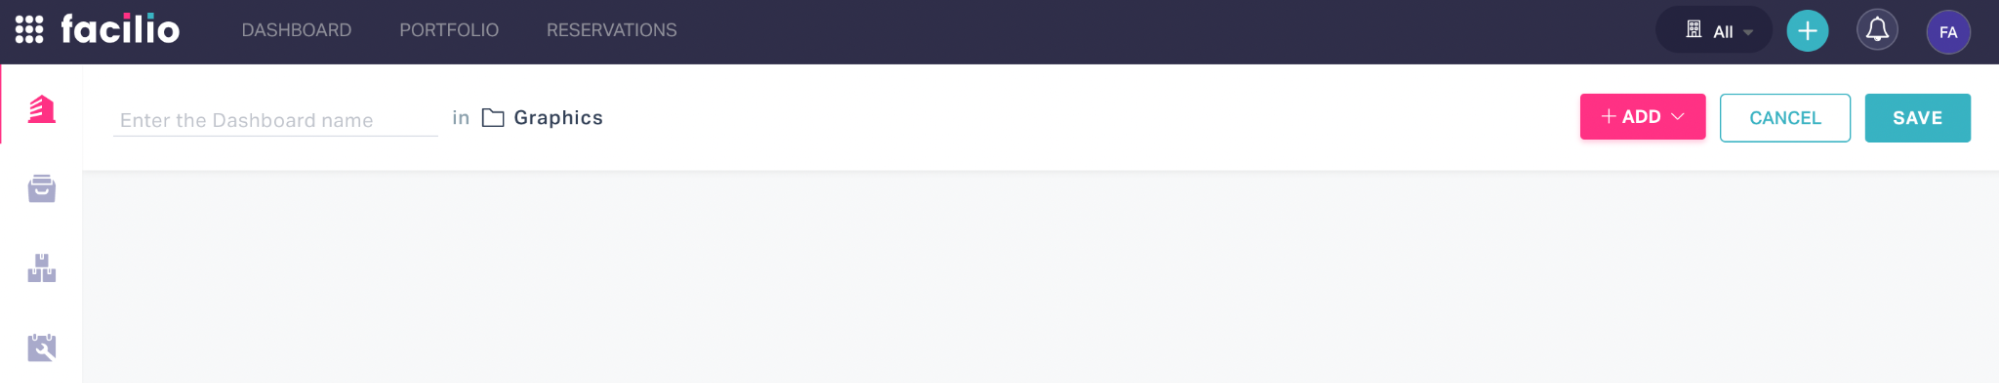
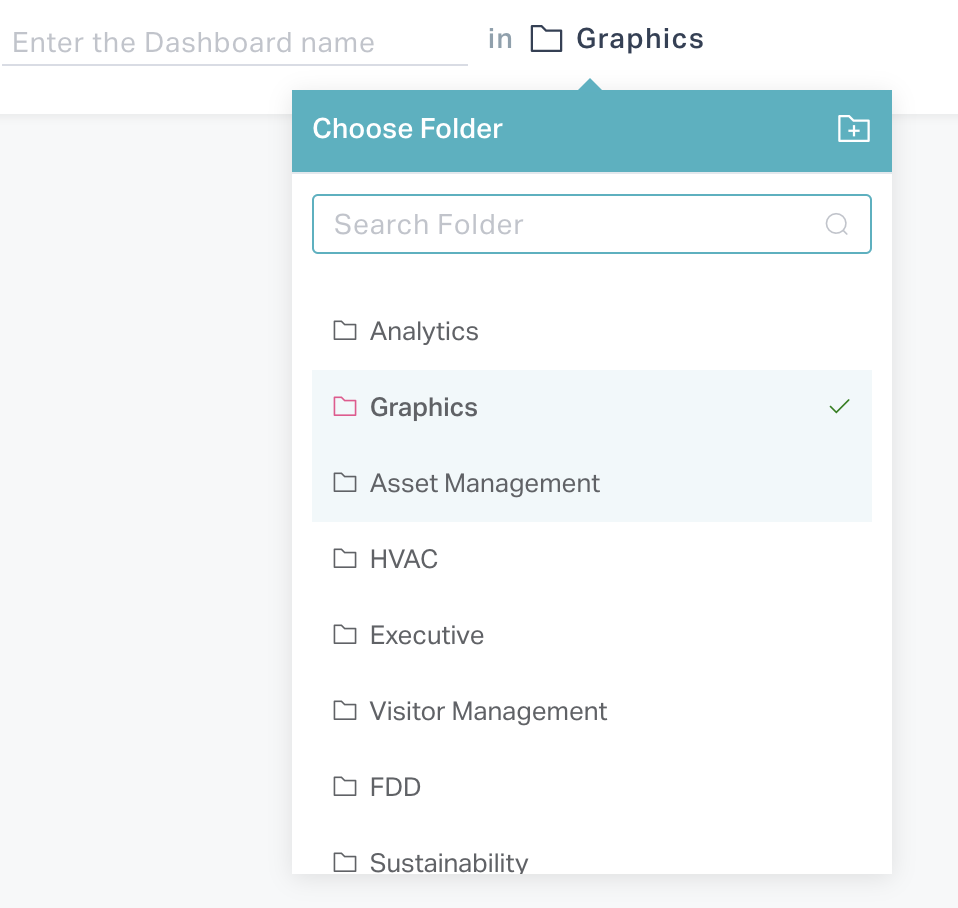
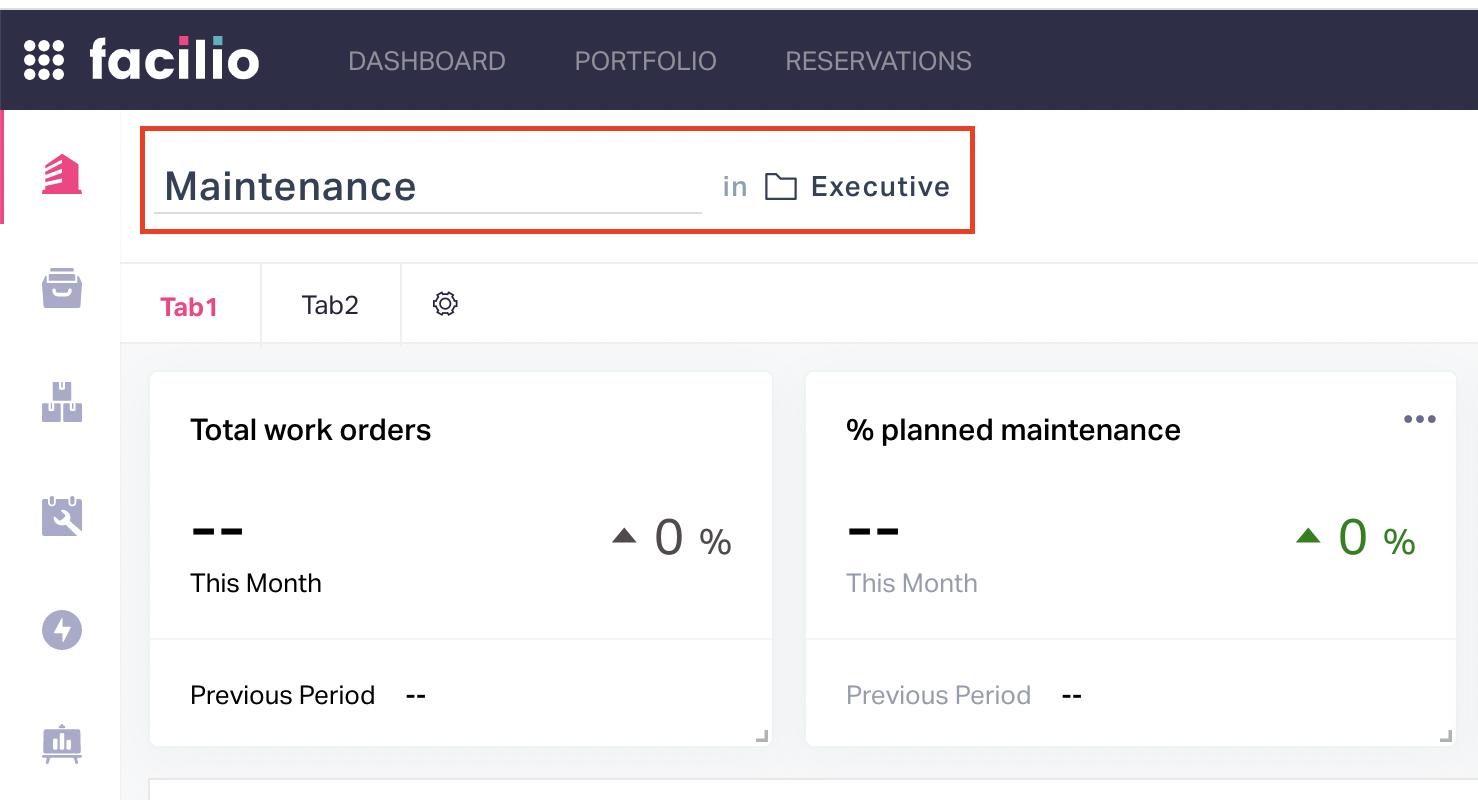
Enter the name of the new dashboard in the Dashboard Name field and select the folder in which the dashboard has to be saved as shown in the screenshot below.
Click ADD and select an item to be displayed in the dashboard.
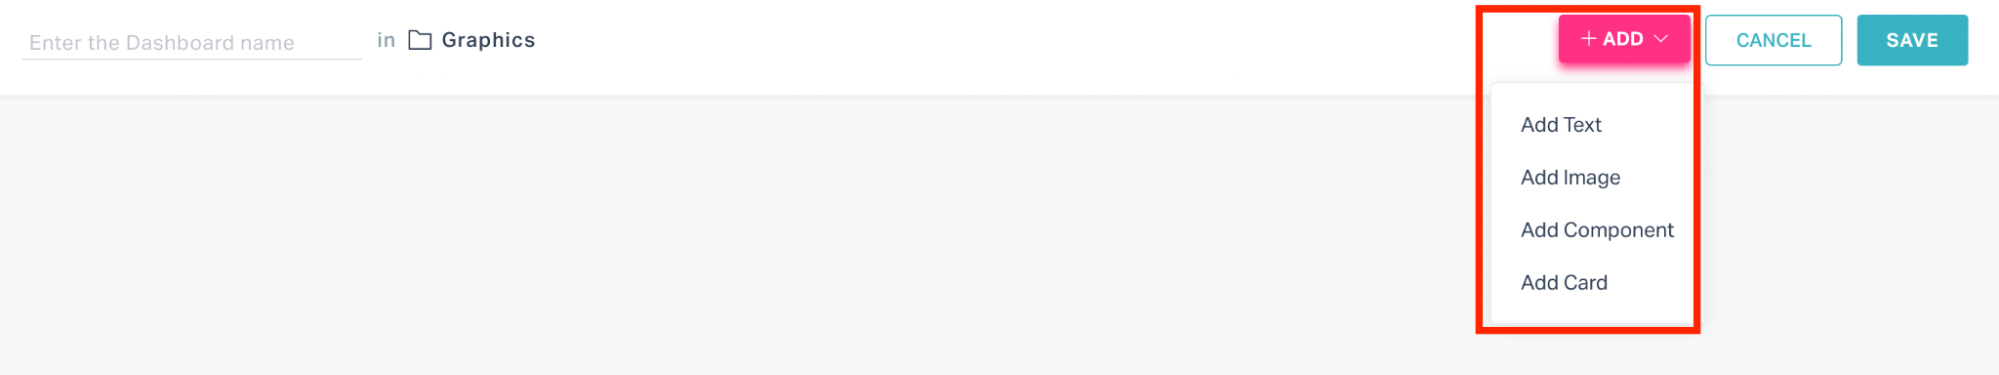
A dashboard can be configured with multiple widgets. You can choose from the following options shown in the screenshot above:
Add Text
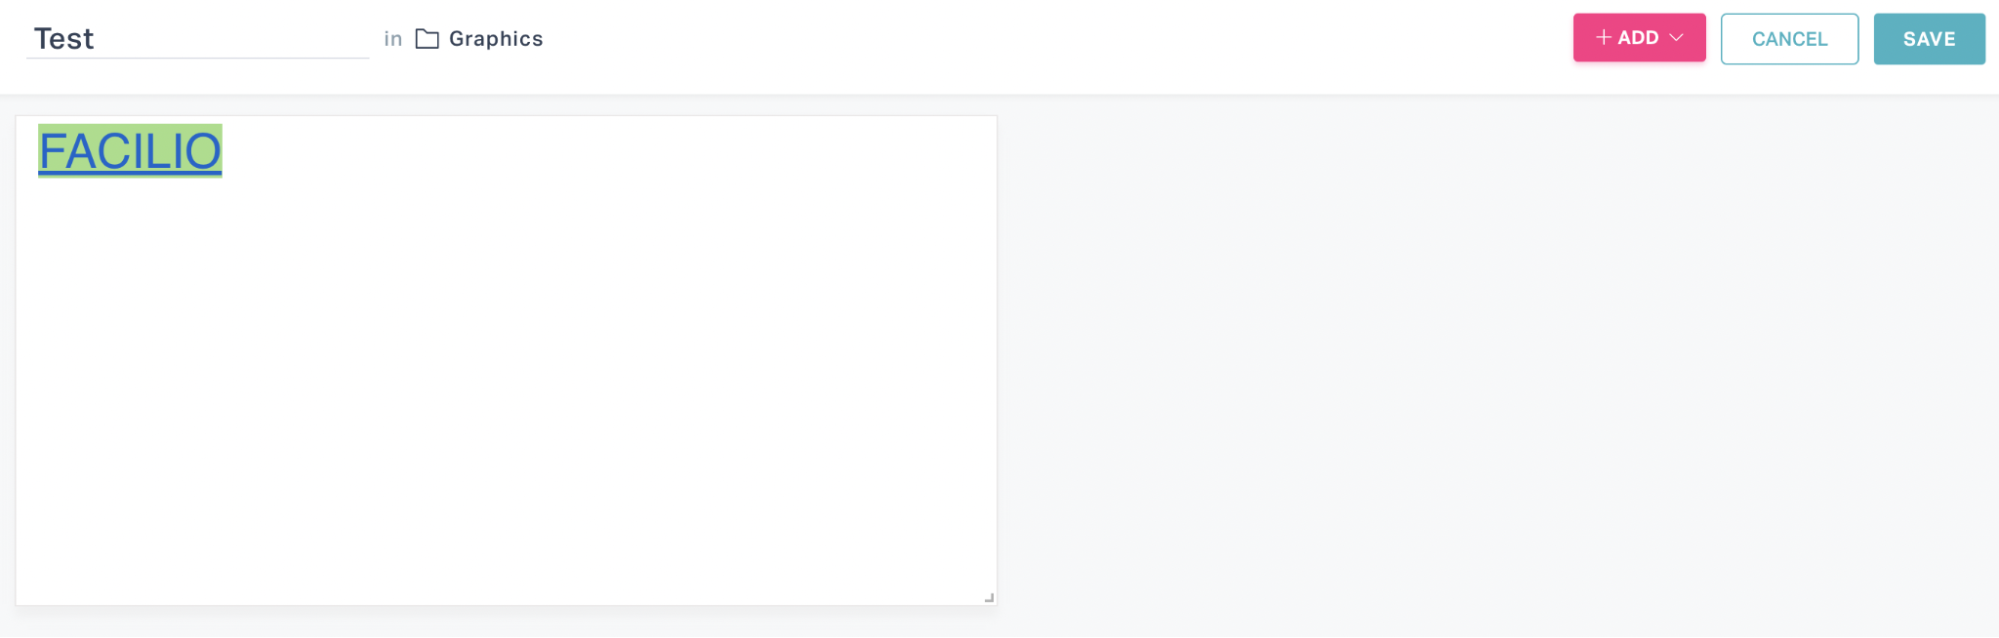
To add text to the dashboard,Select Add Text from the dropdown. The ADD TEXT window is displayed as shown in the screenshot below.
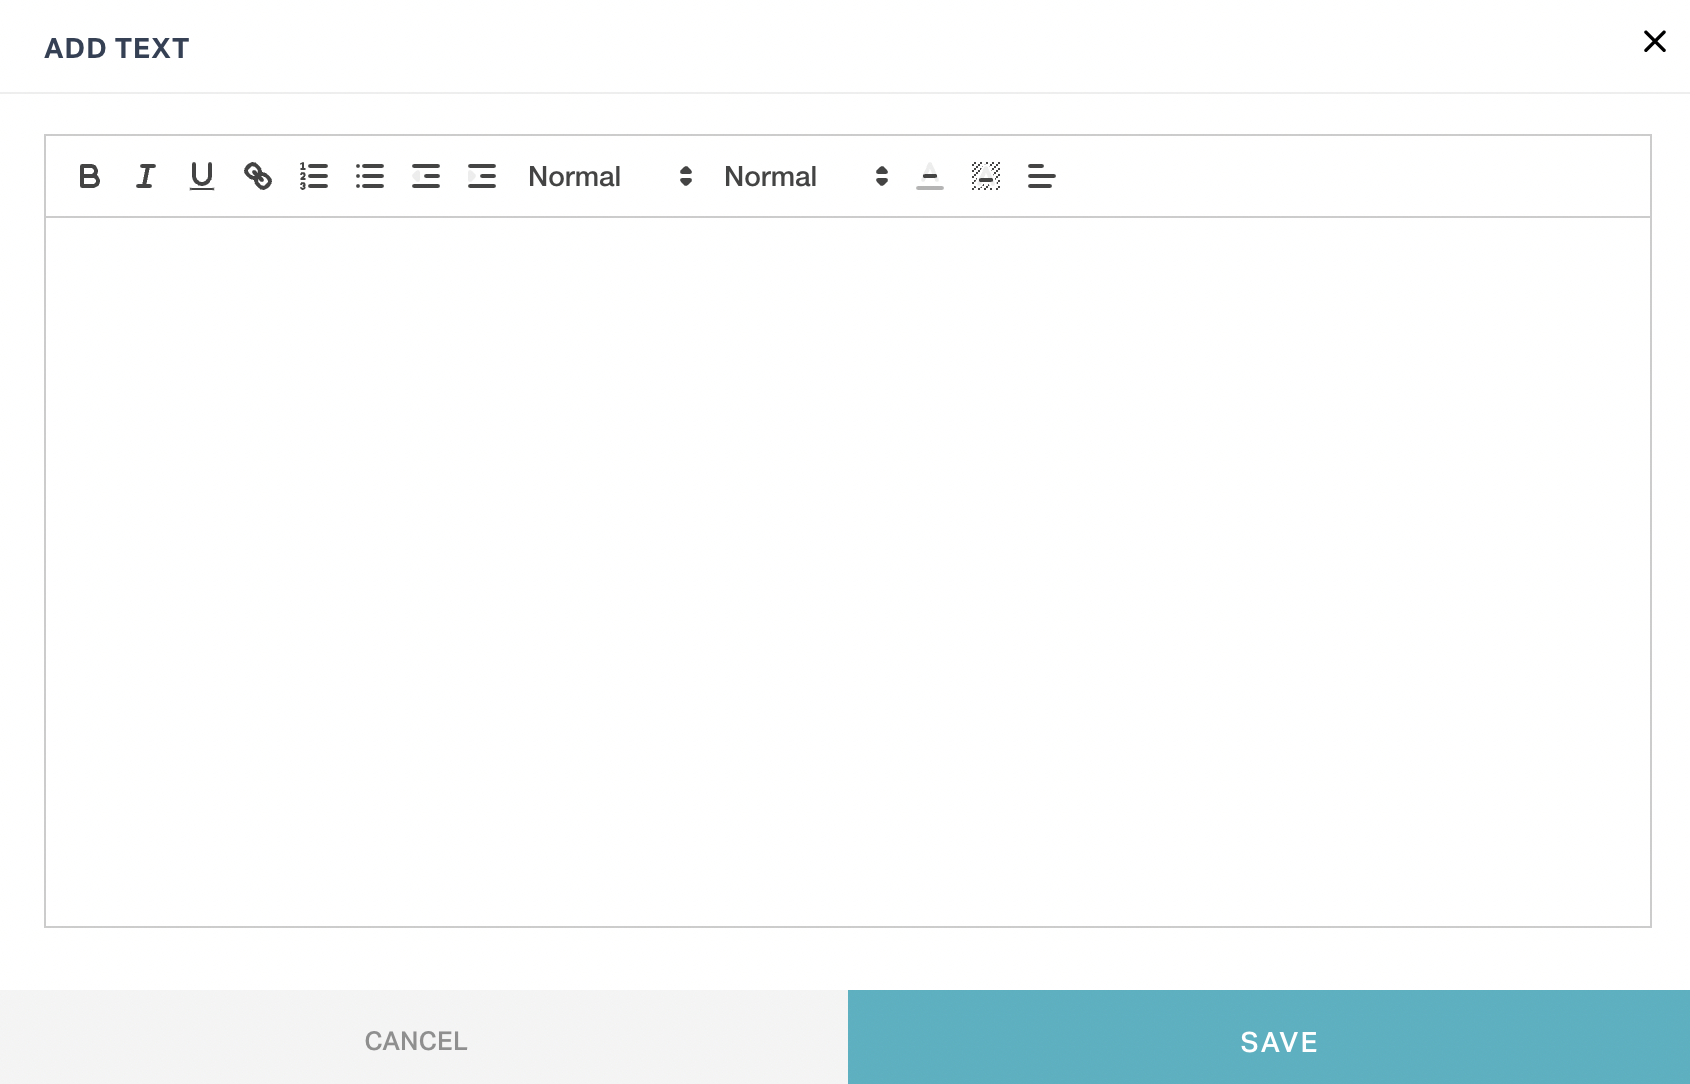
Add the required text
note
You can use the formatting options available in the toolbar to format the text.
Click SAVE. A widget is added to the dashboard with the text as shown below.
Add Image
To add text to the dashboard,
Select Add Image from the dropdown. The IMAGE CARD window is displayed as shown in the screenshot below.
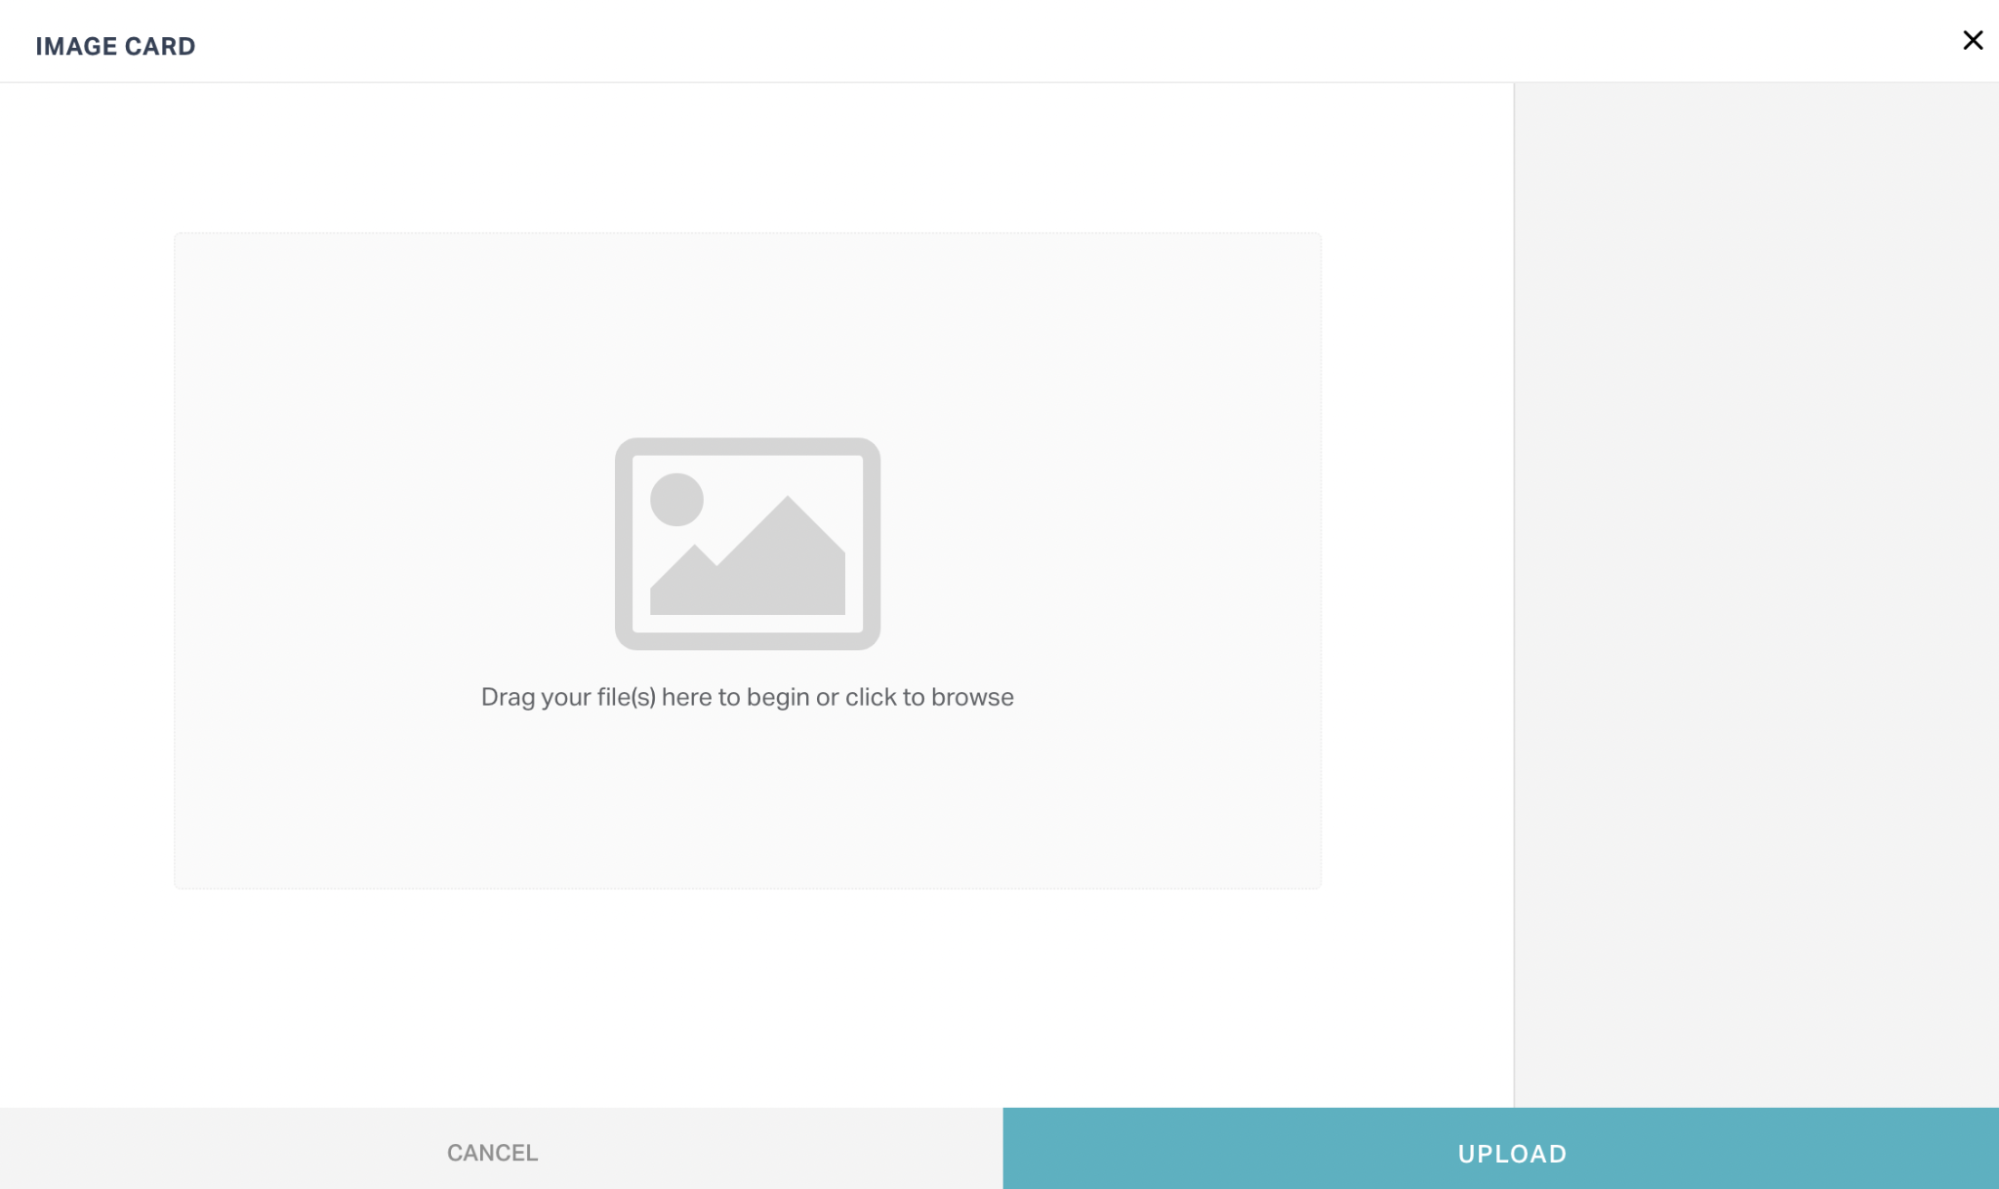
Upload the required image
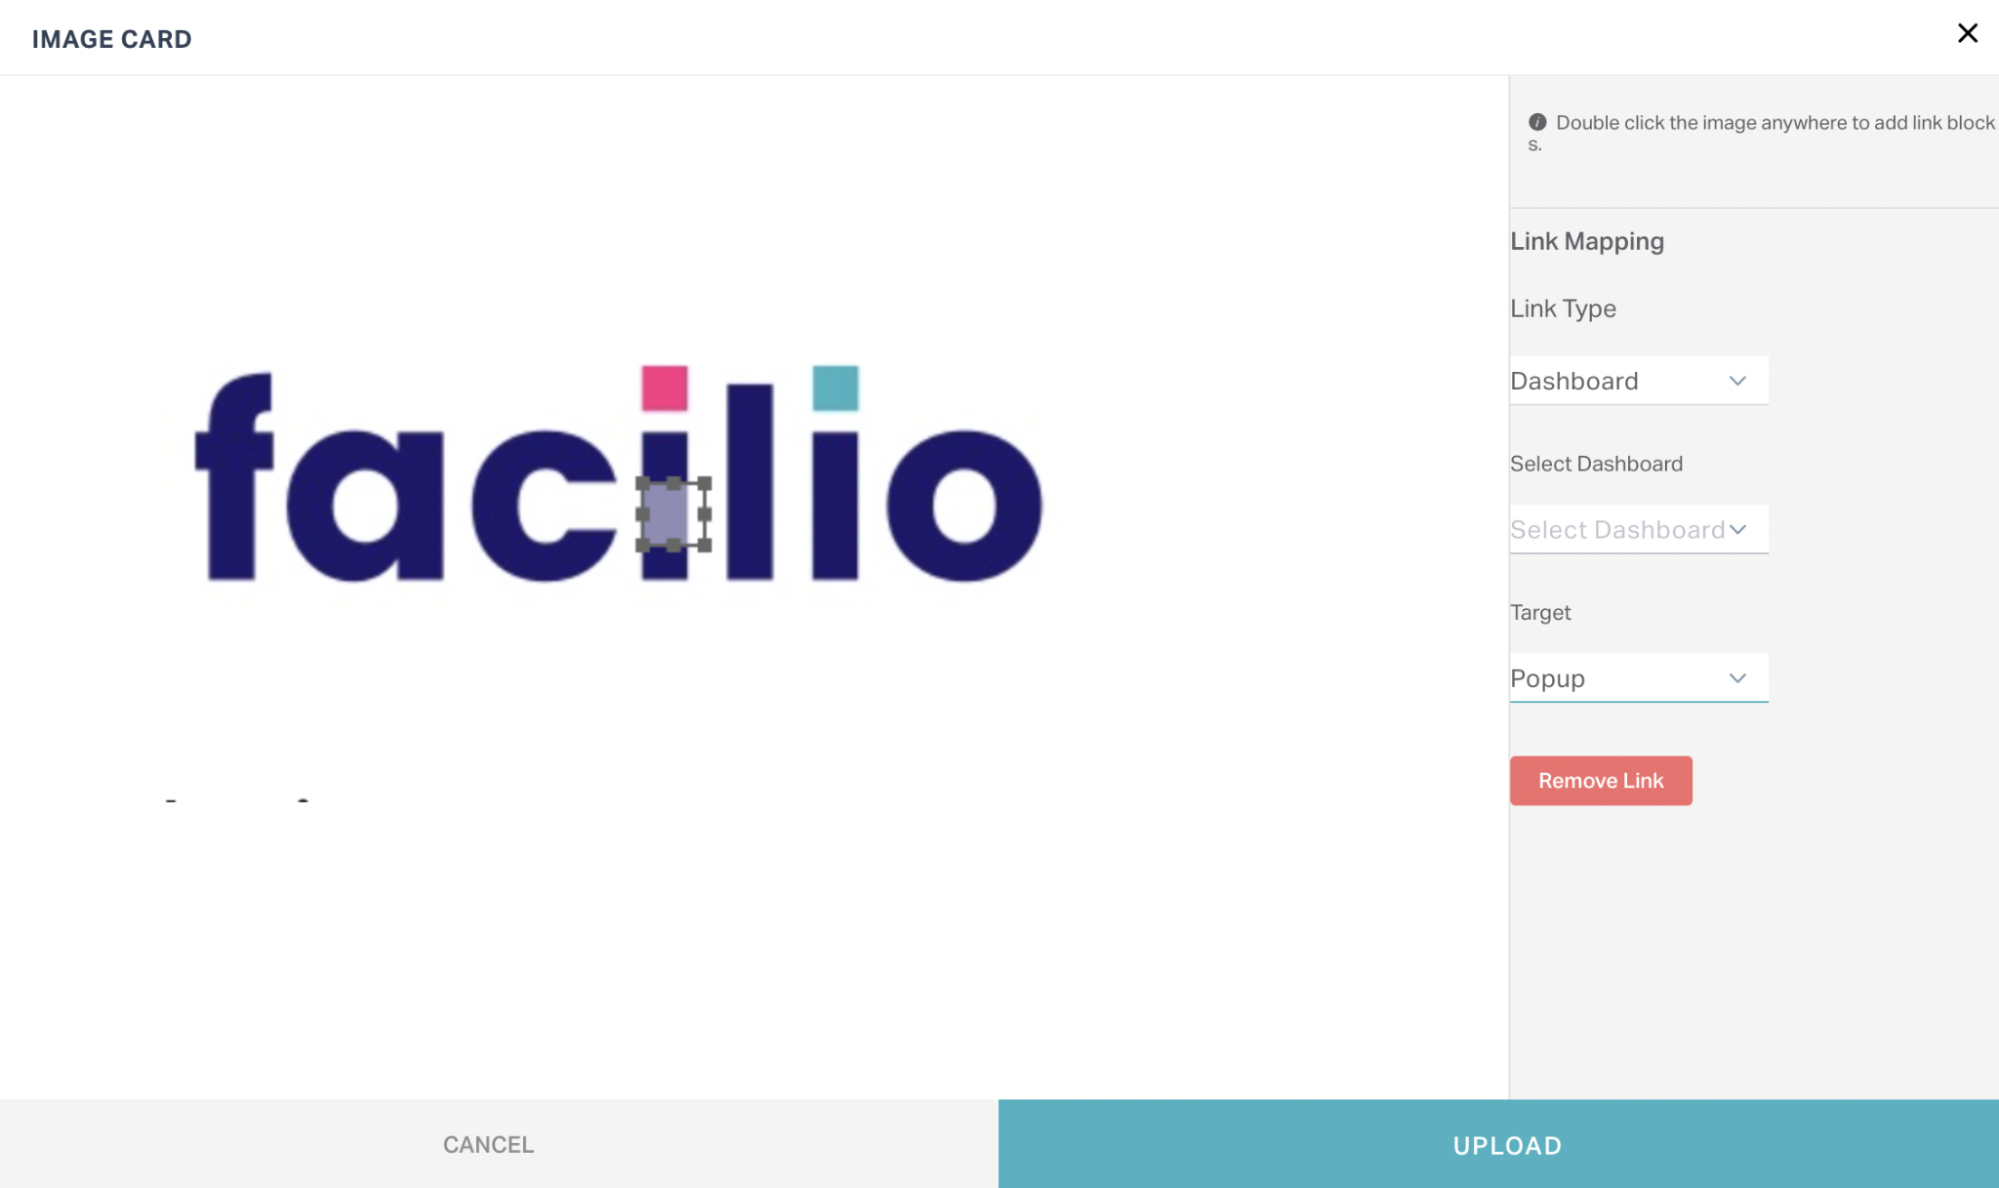
Note: Double-click the image to add hyperlinks to the image. The Link Mapping window appears as shown below.
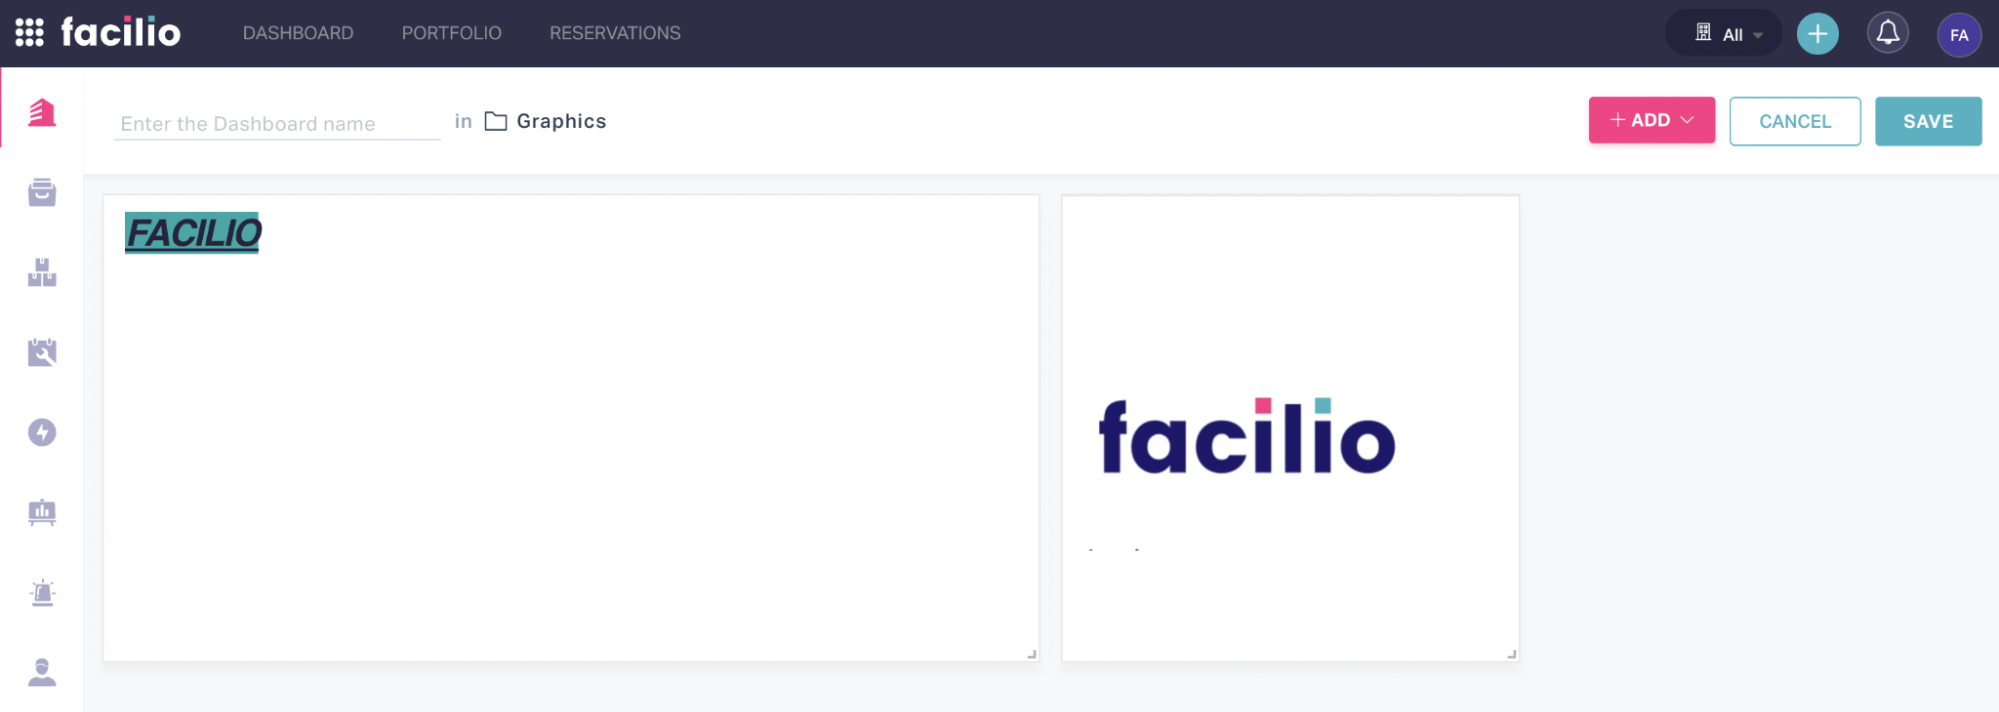
Click UPLOAD. A widget is added to the dashboard with the image as shown below.
Add Component
To add a component to the dashboard,
Select Add Component from the dropdown. The ADD COMPONENT window appears as shown below.
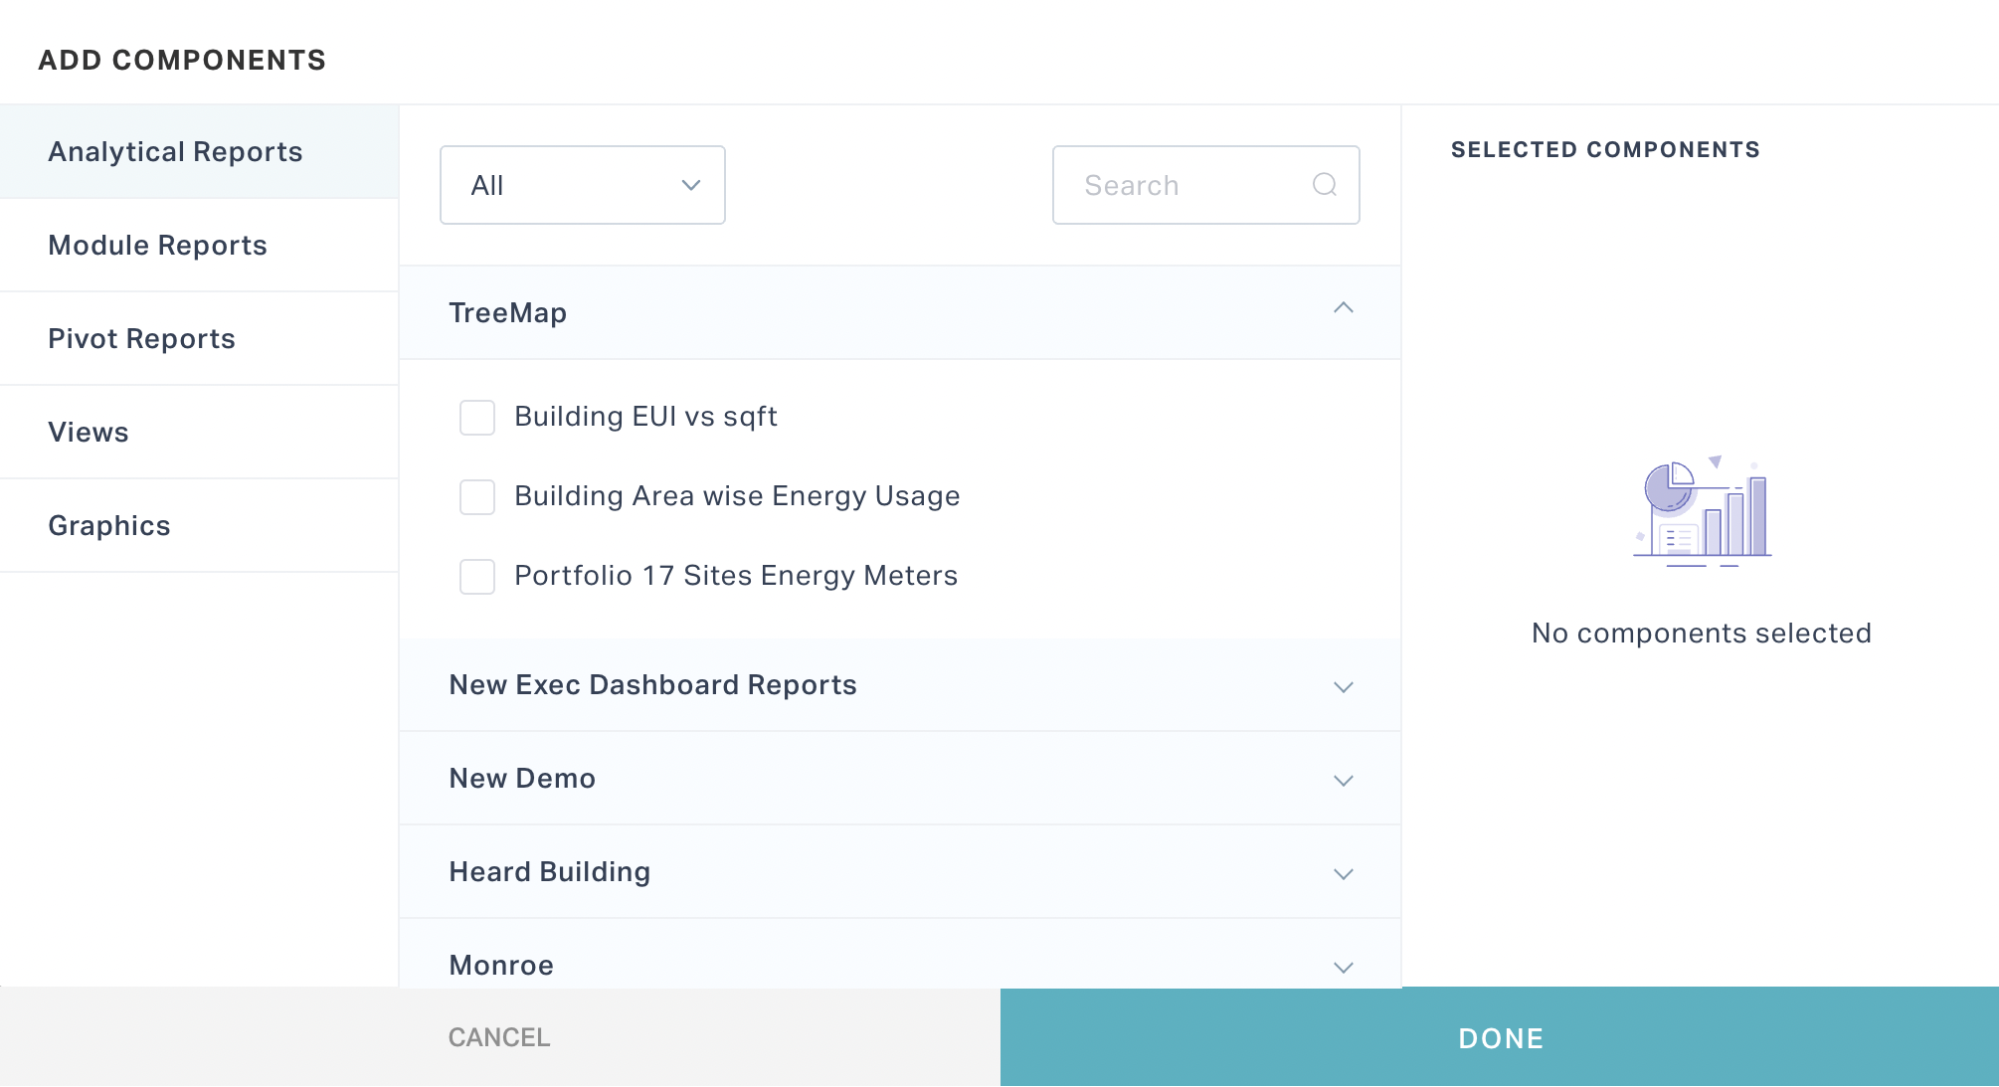
Note: The reports associated with various components (Analytical Reports, Module Reports and so on) are configured from the respective modules.
You can filter the available reports using any of the following options:
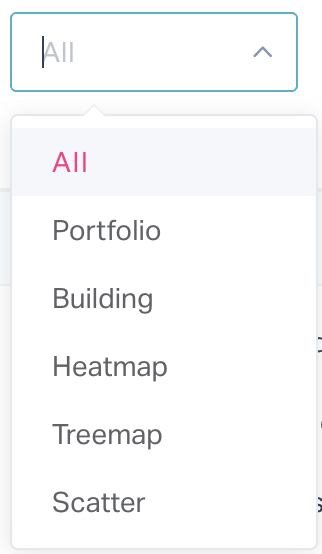
Using the dropdown with respect to the components as shown below.
Using the Search functionality.

Configure the required reports, views and graphical representations. For example, to configure the trend for monthly power consumption, select the required report (Monthly Power Usage) under Analytical Reports.
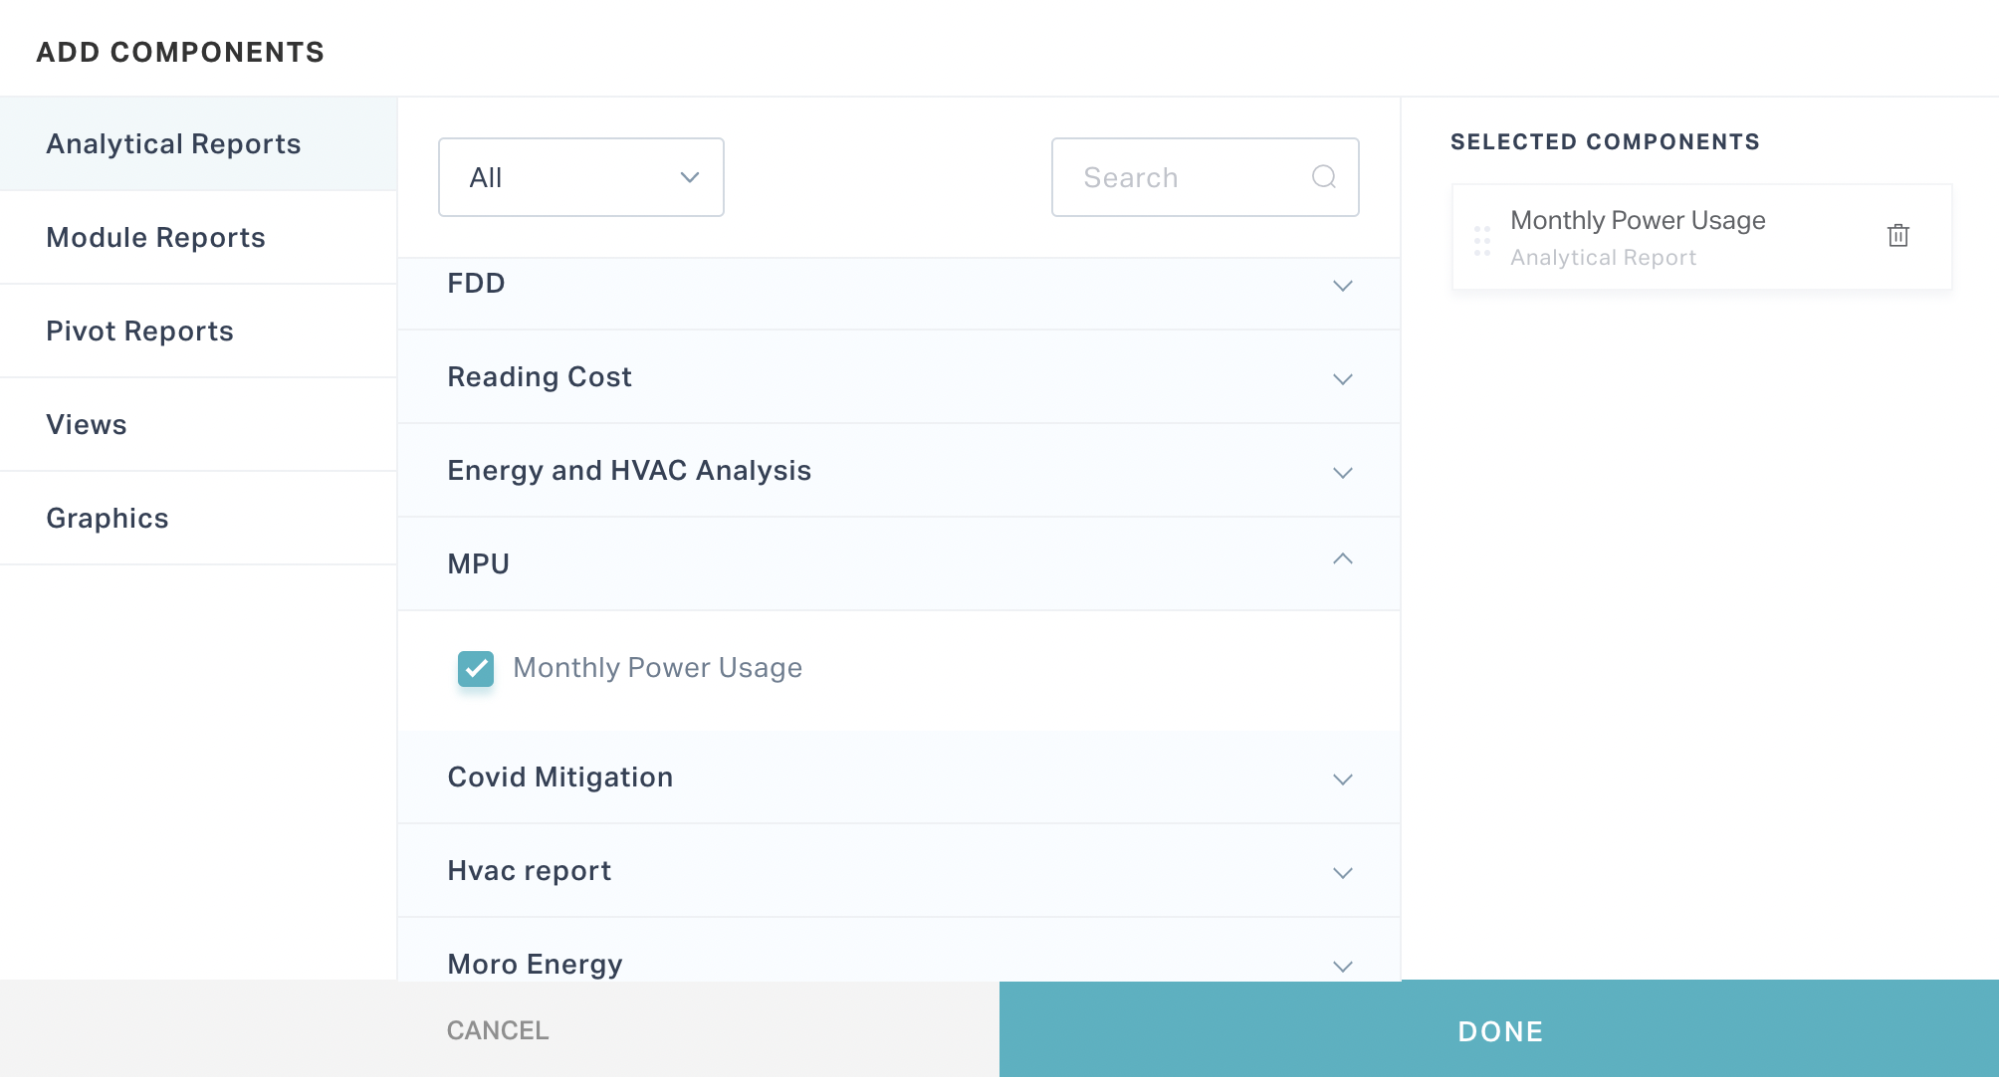
Click DONE. A widget is added to the dashboard as shown below.
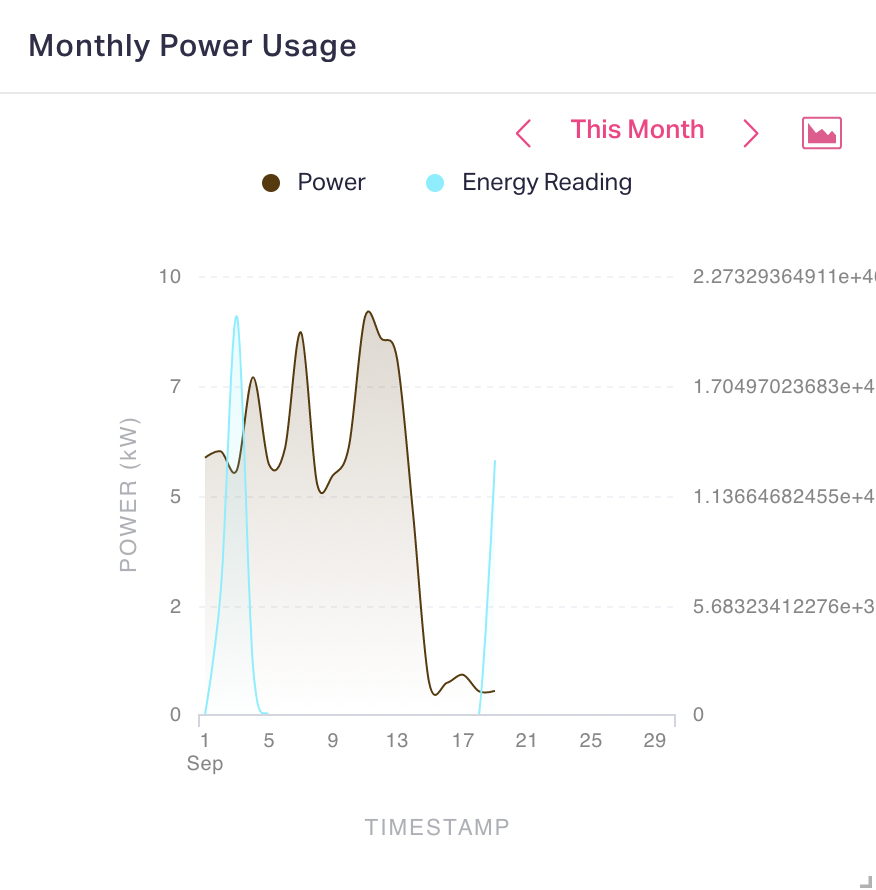
Note: You can modify the type of chart used for the report from the dashboard (read the Modifying Widgets section for more details).
Add Card
To add a component to the dashboard,
Select Add Card from the dropdown. The Add Card window appears as shown below.
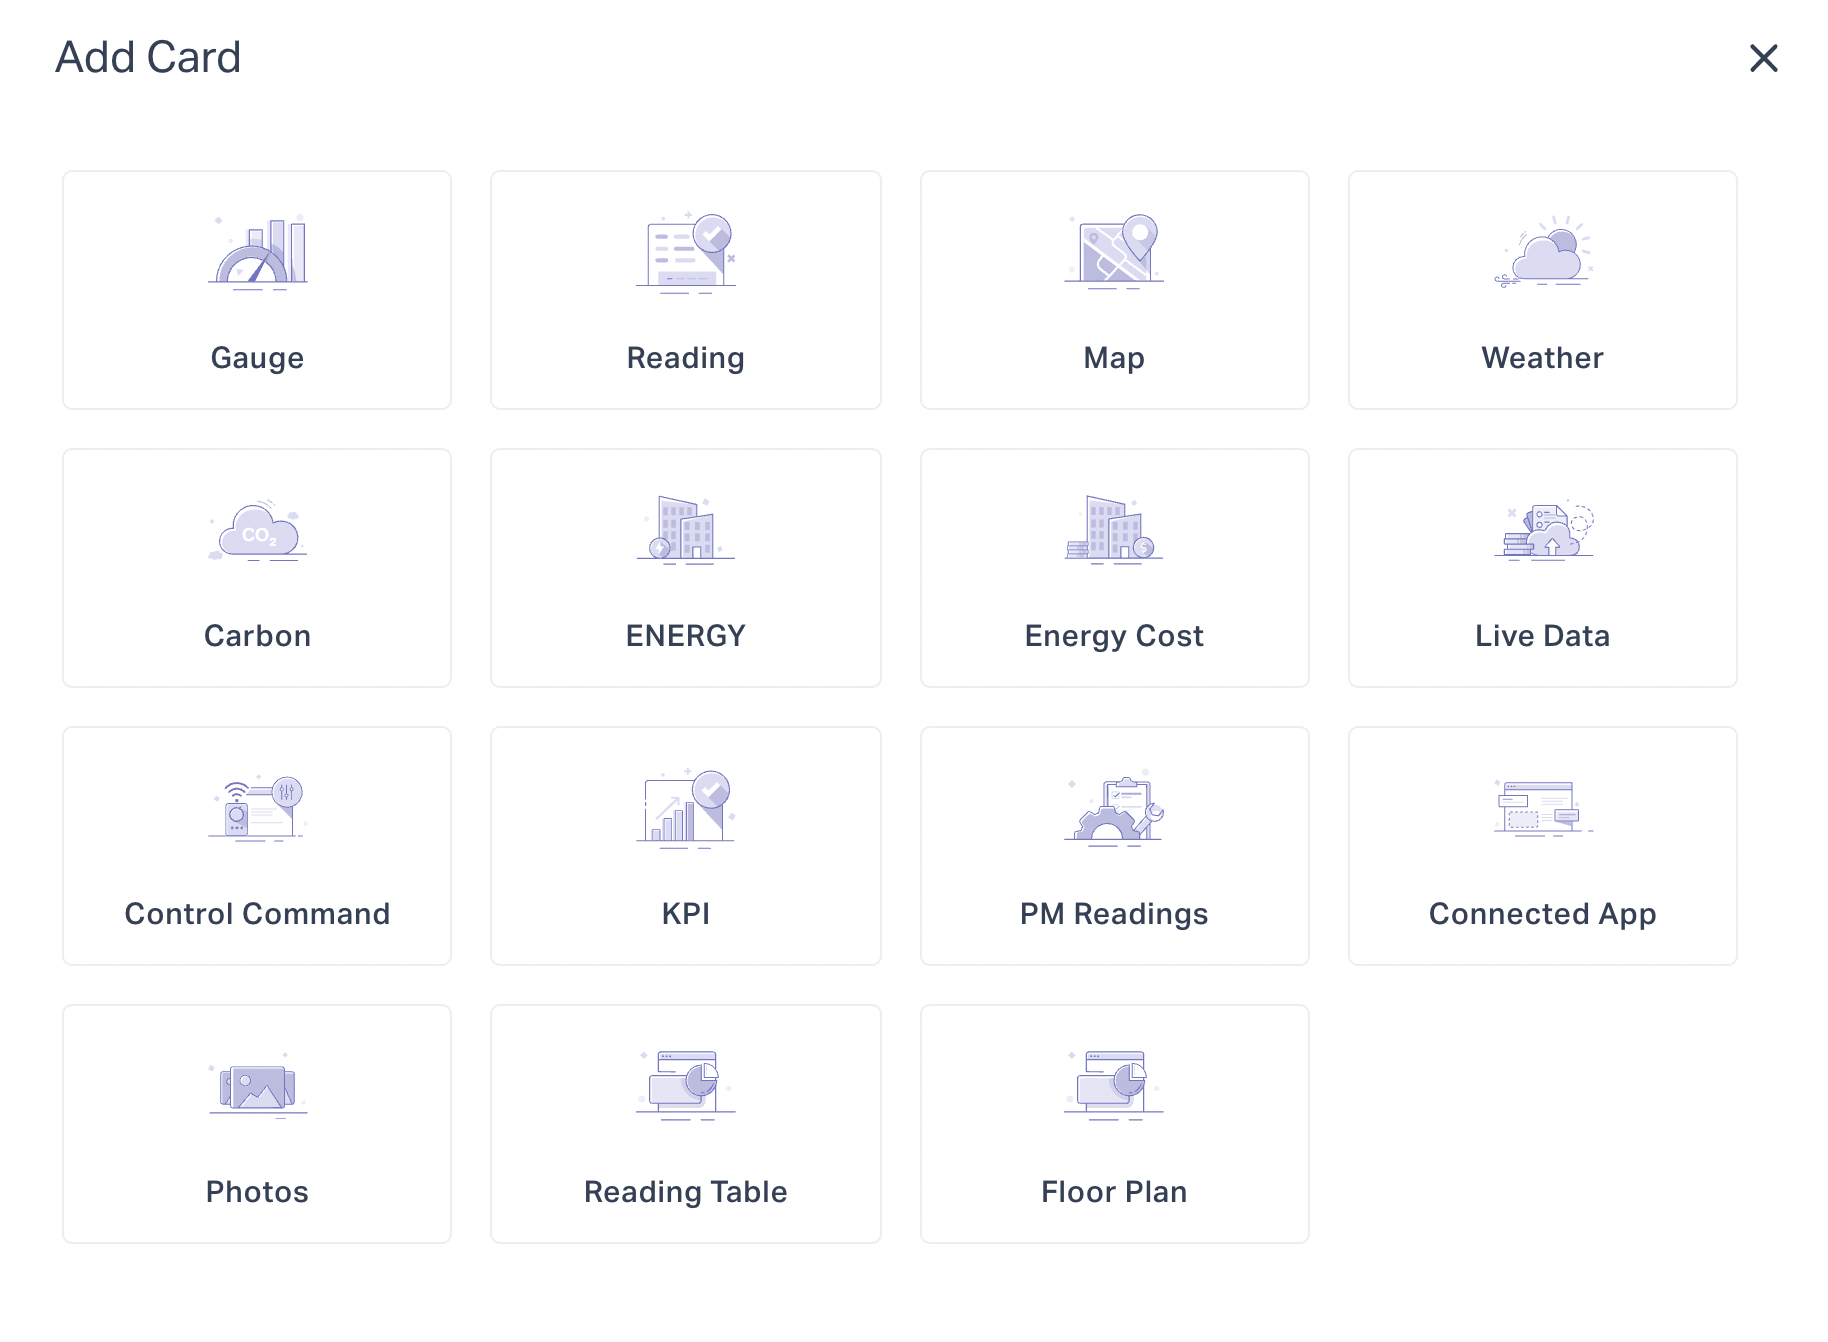
Select the required option from the above screen, to configure the widgets (required readings and other information) to be displayed in the dashboard.
Update the corresponding sections and fields.
Section Field Description CONFIG Title The title of the card to be displayed in the dashboard Space/Asset The space or asset whose readings are to to configured Reading The type of reading to be displayed.
Example: Temperature, enthalpy and so onOperator The operation to be performed over the selected range of readings. You can choose from the following values: - Sum
- Average
- Minimum
- Maximum
- Last value
Period The range of data to be taken into account.
Example: This week, today, last month and so onBaseline The value with respect to which the trend of current data will be determined Example: Previous month Multiplication Factor The value to be multiplied with the selected reading
Note: This field contains a default value.FILTERS Criteria The criteria on which the selected readings are to be filtered. Update the following dropdowns: - Column - Column to be filtered
- Operator - Condition to be applied to the selected column
- Value - Applies with respect to the operator chosen
Note: Multiple criteria can be created to narrow down the selection.Sorting The order in which the selected reading will be arranged. Update the following dropdowns: - Field - The column to be sorted
- Order - The order by which the data will be sorted, that is, ascending or descending
STYLES Text and Background color The colour of the following components: - Primary text
- Secondary text
- Background color
Decimal Place The decimal place(s) of the reading to be displayed in the card Unit The unit of the reading Position The position of the reading unit, that is, prefix or suffix Card Image The icon image to be displayed in the card for the reading ACTIONS Action Type The representation or action required for the readings
Example: Show trend, show report, control action and so onFORMATTING Criteria The condition to be applied over the calculated reading. Update the following dropdowns: - Value - Refers to the calculated reading
- Operator - Operator used for comparison
- Input - Applies with respect to the operator chosen
Formatting The formatting to be applied to the card for the condition rule. You can specify colours for the following components: - Primary text
- Secondary text
- Indication Arrows
- Background color
Blink Check box that enables the primary text (reading) to blink upon the condition being satisfied Display Value The value to override the reading upon the condition being satisfied Note: Multiple condition rules can be created for a card. You can select the required condition to be applied. Note: Sections and fields may vary with respect to the selection made in the Add Card screen. Most of the fields explained in the above table are common across the cards and you may have to update additional fields and sections respective to the selected card type.
Click SAVE. The dashboard is now updated with the configured widgets.
You can further customize the dashboards upon configuring filters and timelines common across wizards, and multiple tabs in a single dashboard.
Configuring Filters and Timeline
To configure the default filters and timeline for a dashboard,
Click the
 (vertical ellipsis) icon at the top right of the respective dashboard and select Configure filters.
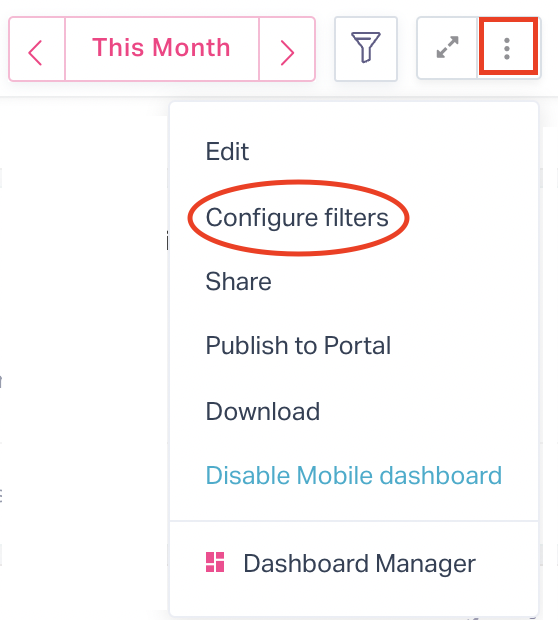
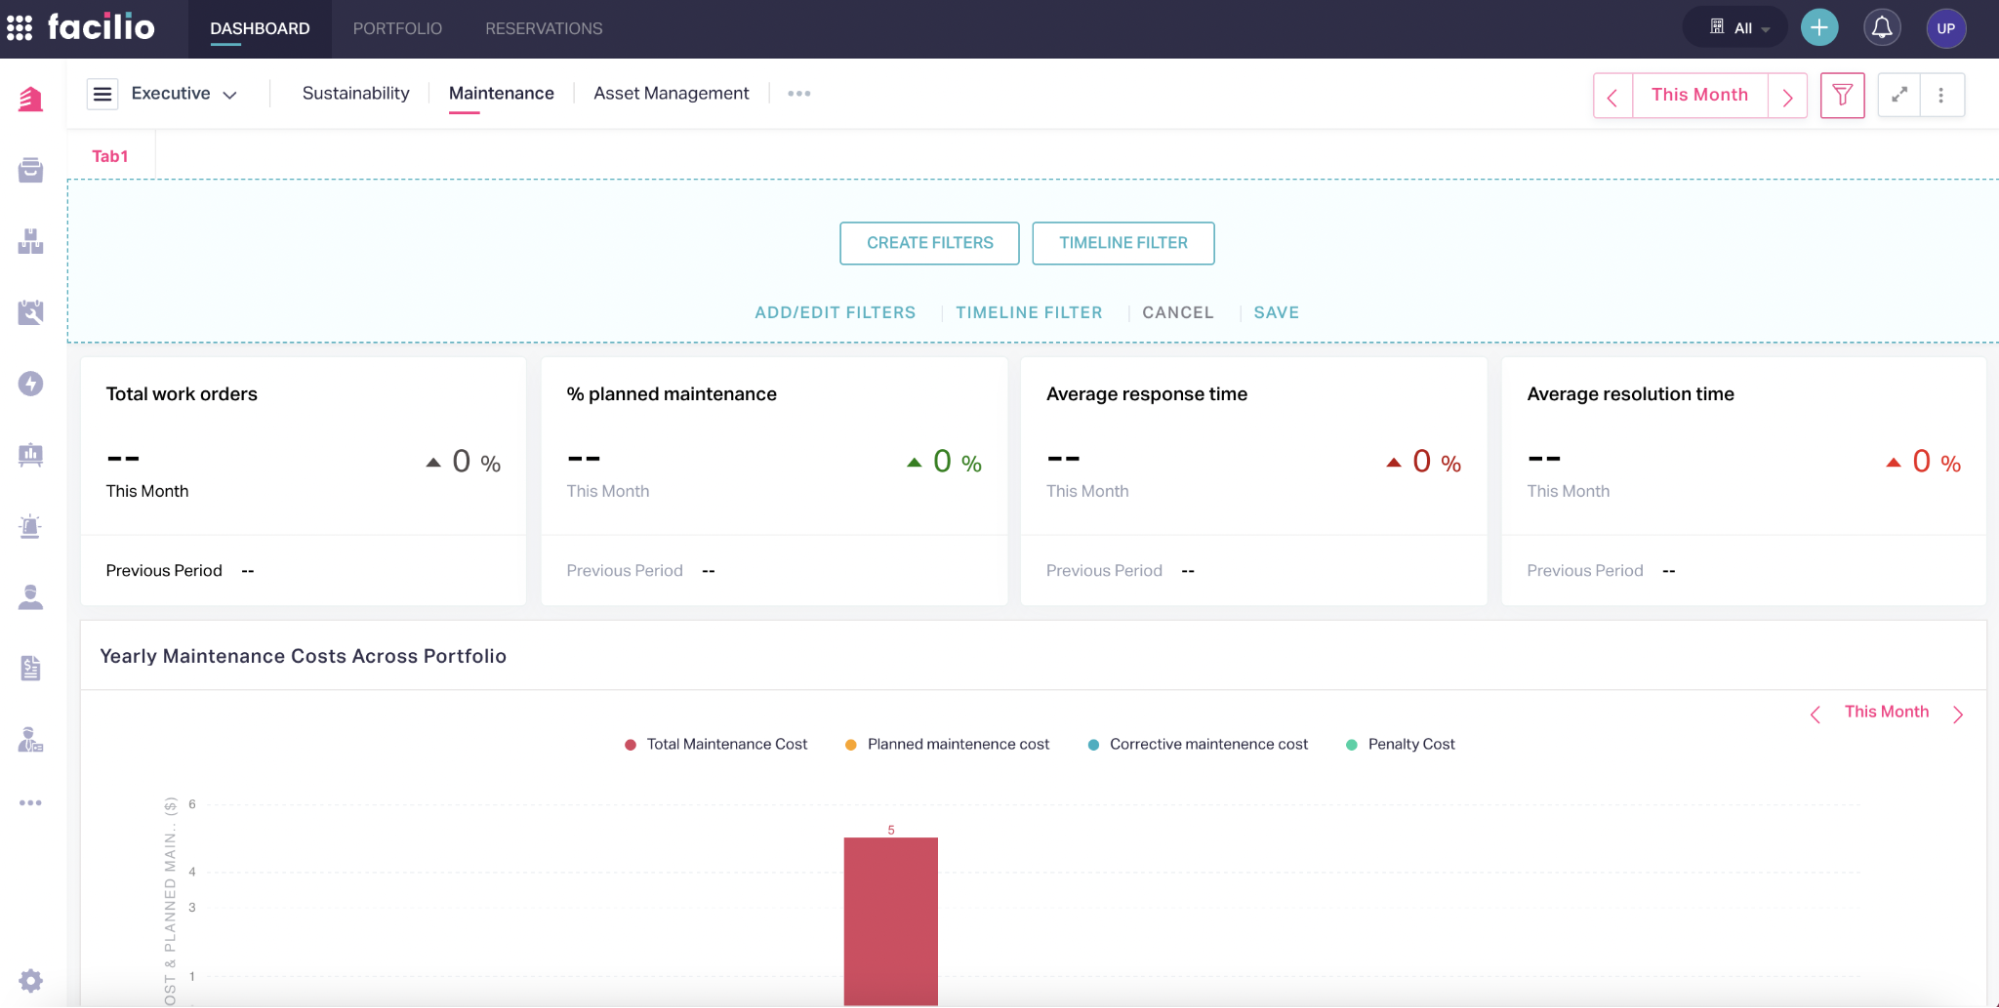
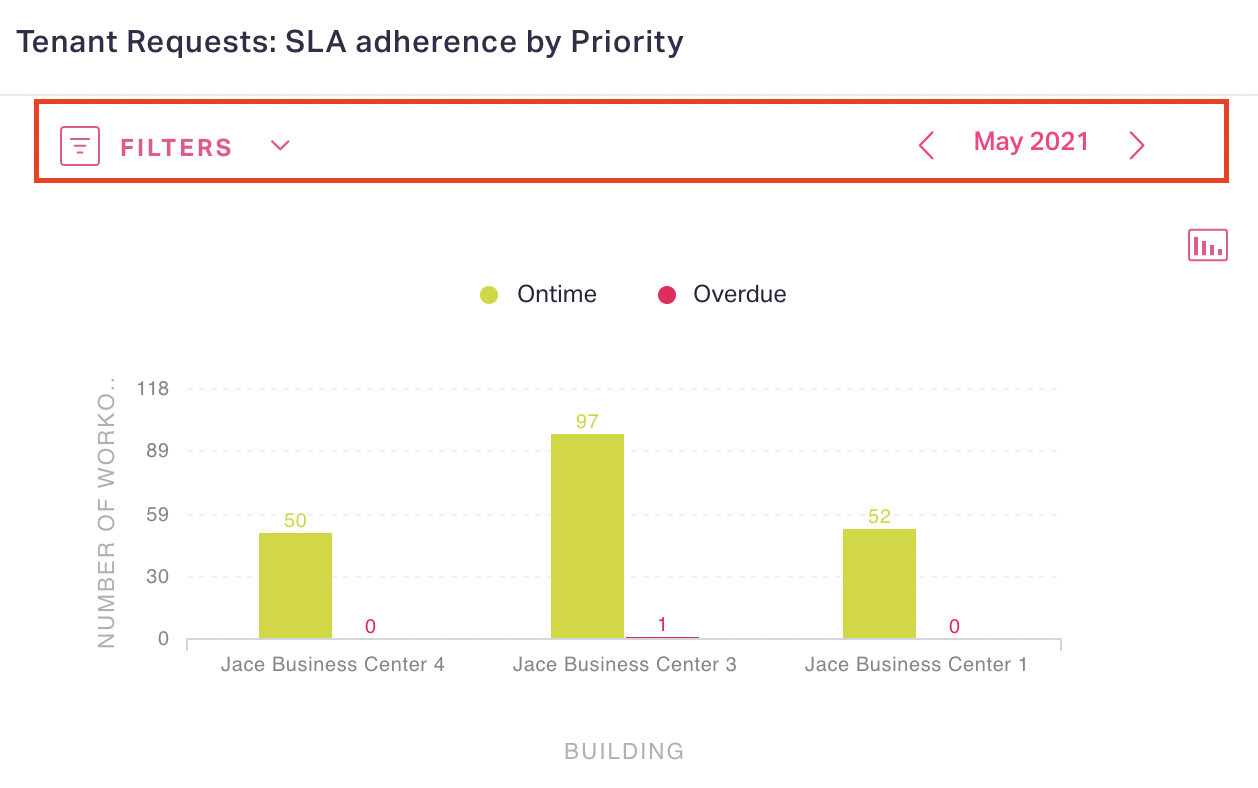
A new panel appears at the top of the dashboard as shown below.
Perform the following configurations:
Filters
To create new filters,
Click CREATE FILTERS. The DASHBOARD FILTERS window appears as shown below
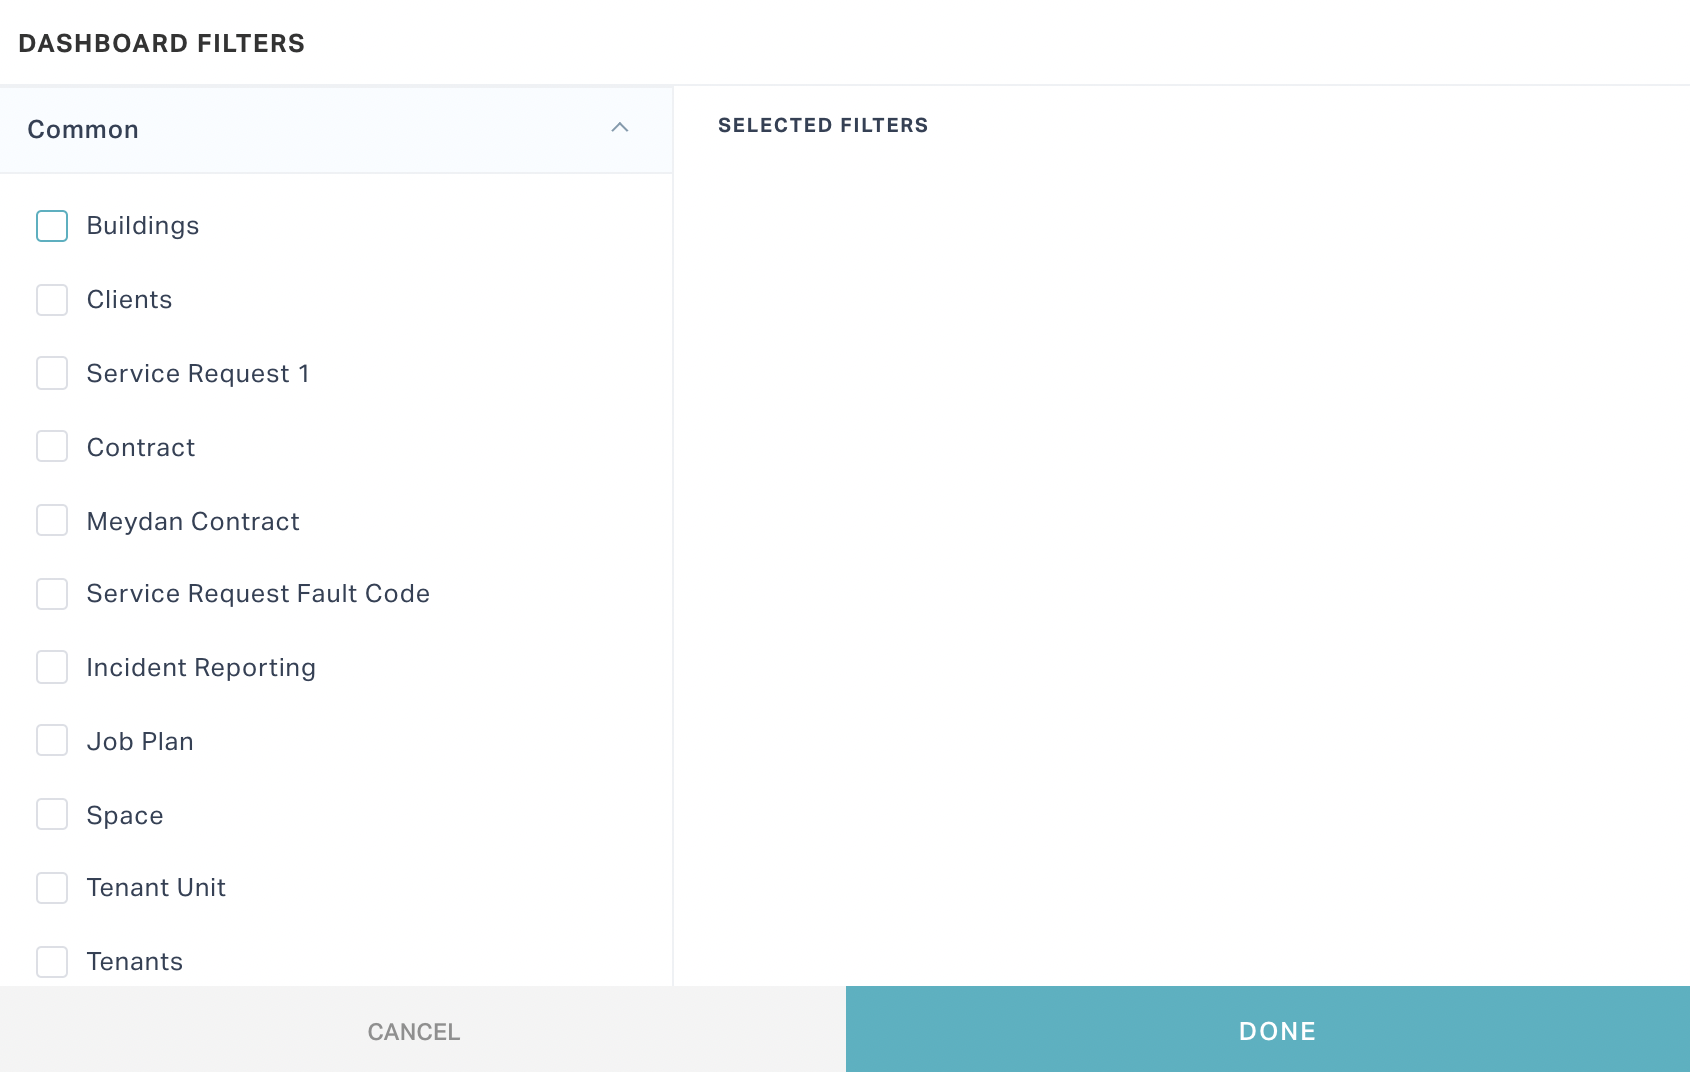
Select the required filters from the displayed list of columns.
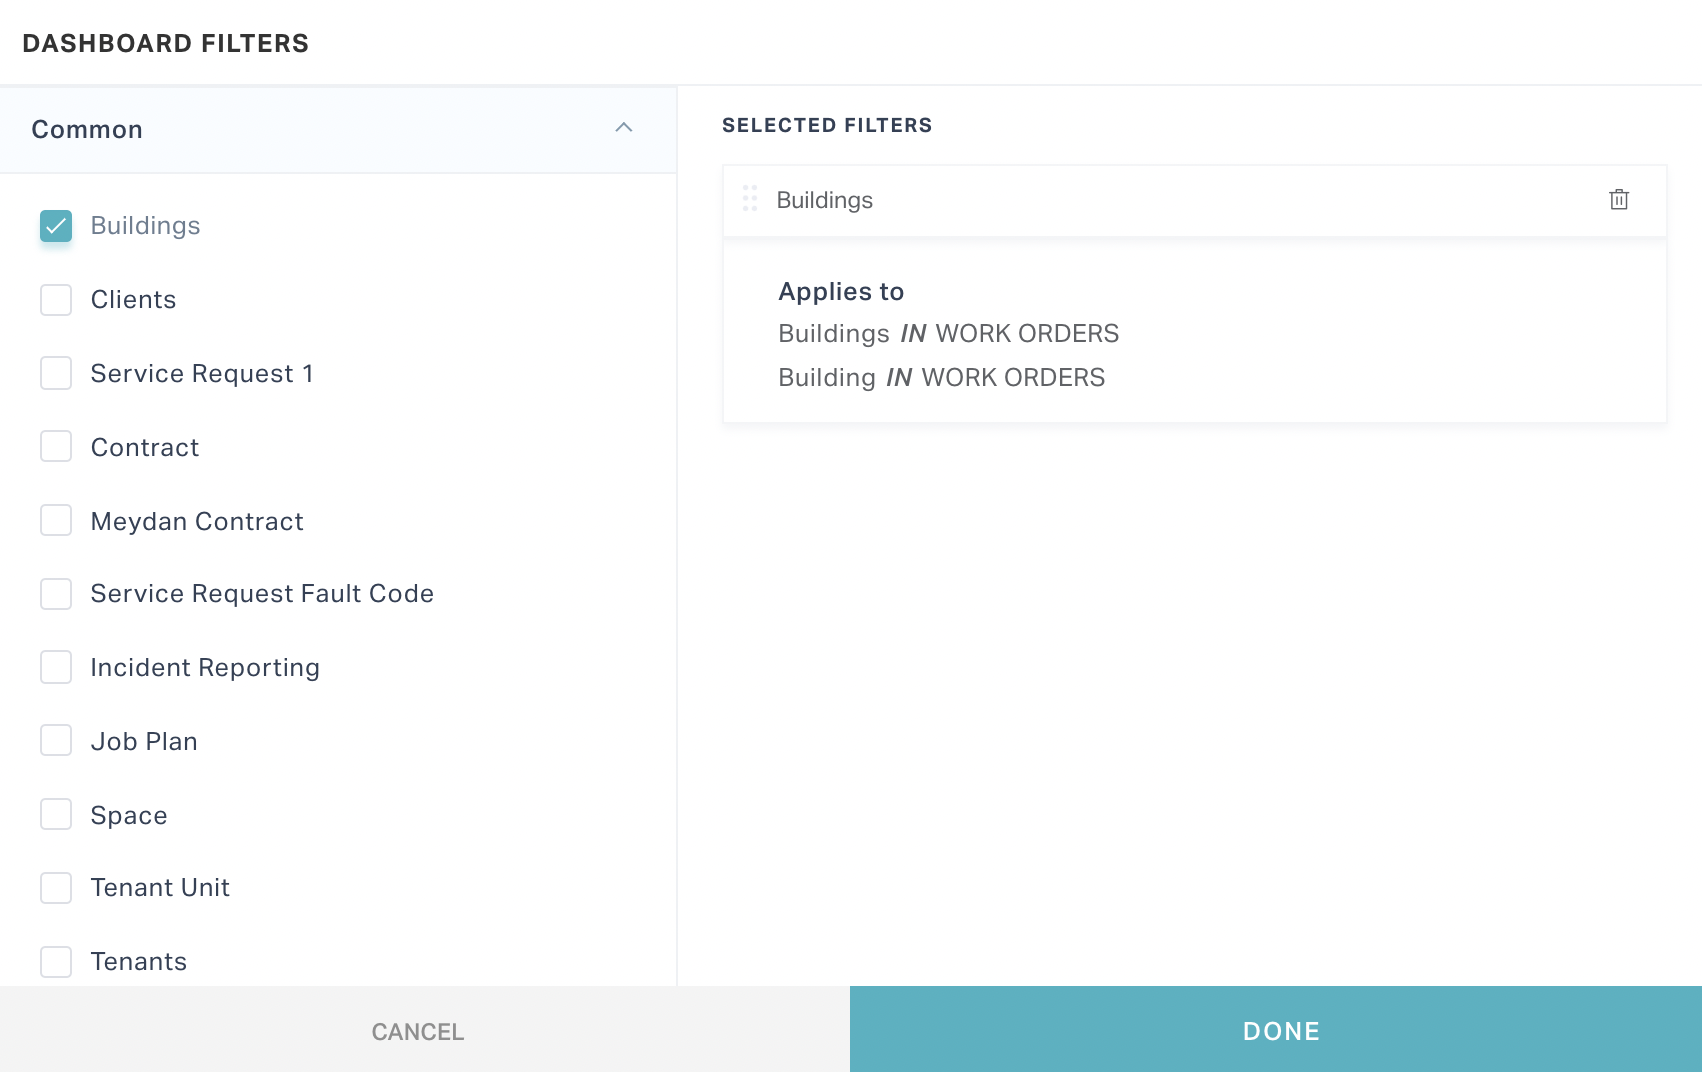
Note:The selected filters are displayed in the SELECTED FILTERS section in this window. You can use the
 (delete) icon respective to the filter to unselect it.
Click DONE.
Timeline
To configure default timeline,
Click TIMELINE FILTER. The DASHBOARD FILTERS dialog appears as shown below.
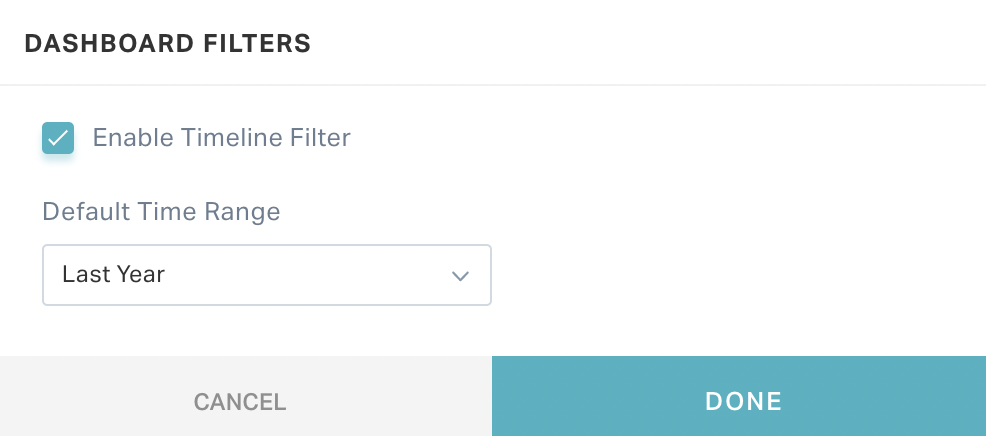
Set the Default Time Range field to the required timeline.
Note: Ensure that the Enable Timeline Filter field is checked to apply this selection as default timeline filter.
Click DONE. The filter in the dashboard header is now updated with the Default Time Range set.
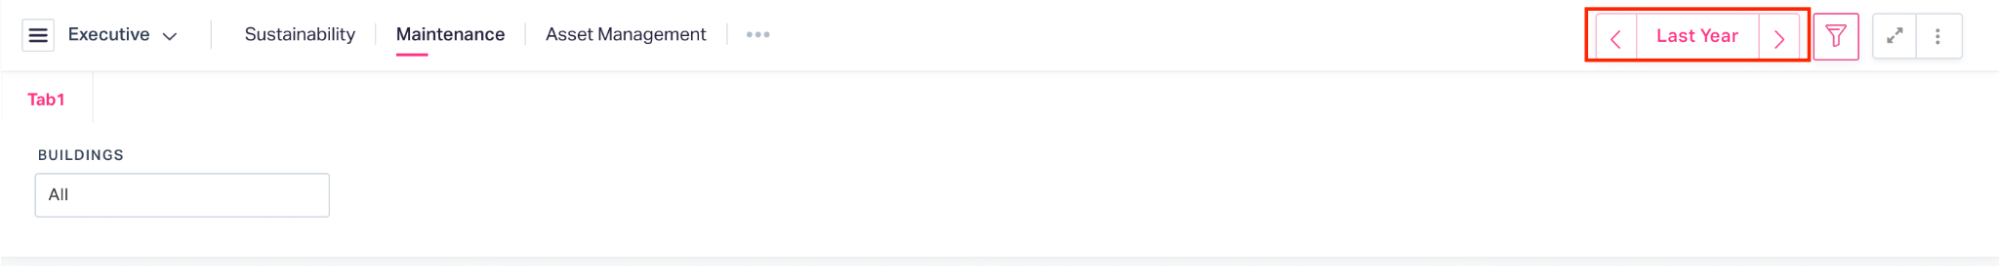
Note: You can click this filter to switch the default filter selection displayed.
Click SAVE. The default filter and timeline configuration for the dashboard are saved.
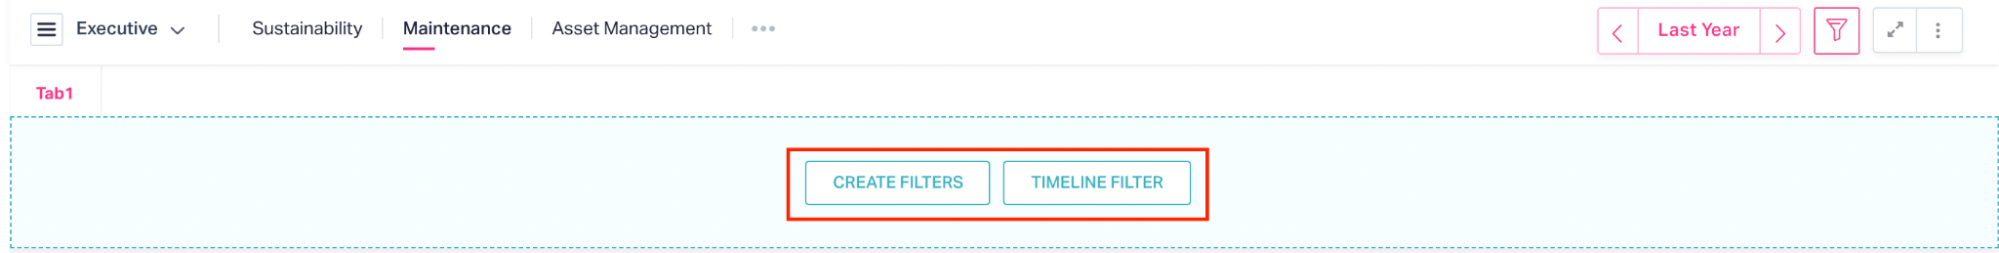
Note: Click the  (filter) icon in the dashboard header to view or hide the filter panel. If you click this icon without having any filters configured, CREATE FILTERS and TIMELINE FILTER options are displayed as shown below.
Configuring Multiple Tabs
To configure tabs in a dashboard,
Click the
(vertical ellipsis) icon at the top right of the dashboard and Edit.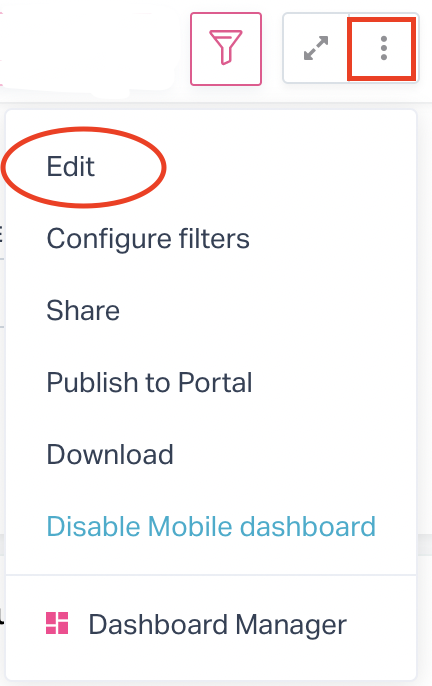
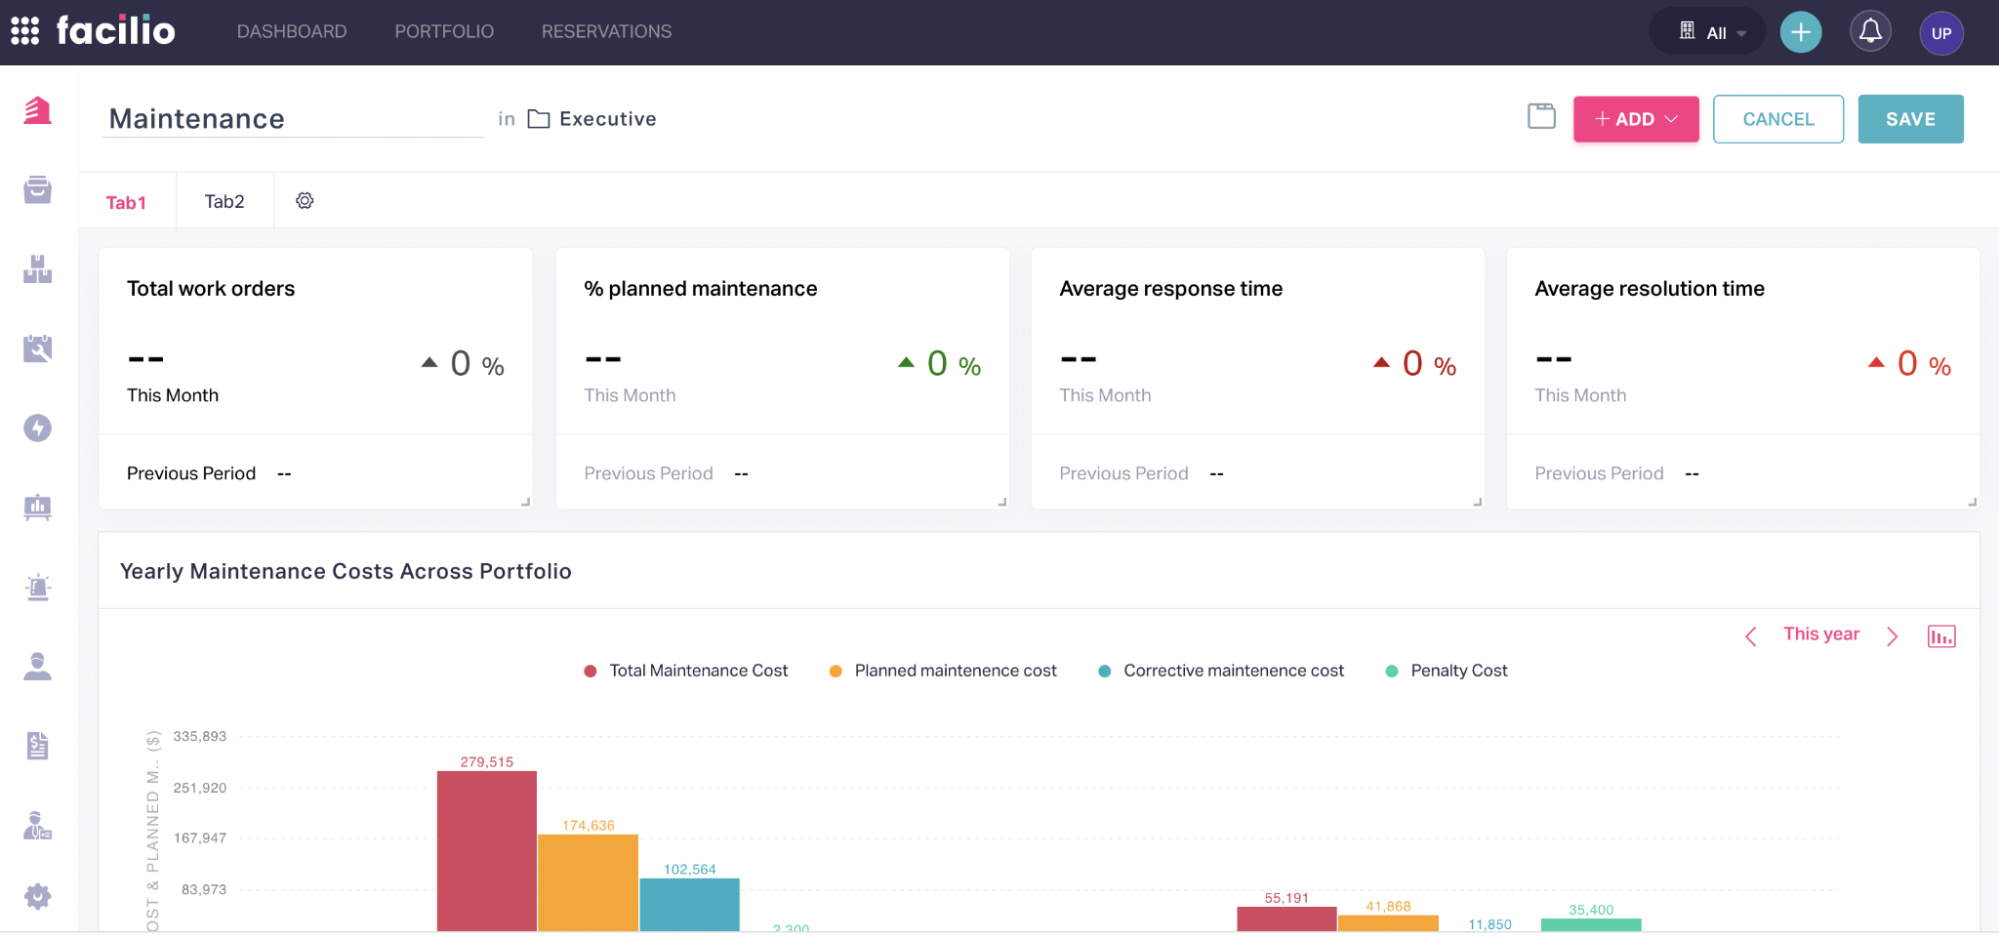
The dashboard appears in editable mode as shown below.
Note: Alternatively, you can edit the dashboard upon clicking the
(vertical ellipsis) icon corresponding to the dashboard in the Dashboard Manager.Click the
 (Edit Dashboard Tabs) icon. The Tab Options dialog appears as shown below.
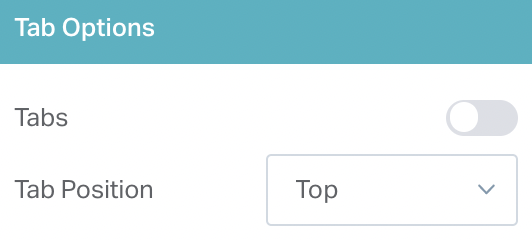
The Tab Position field indicates the positioning of the tabs in a dashboard. You can choose to position the tabs at the top or left side of the dashboard.
Turn on the Tabs toggle button to enable tab configuration. The DASHBOARD TAB window appears as shown below.
Check the Copy all widgets to a new tab field and provide a name for the new tab in the Tab Name field that appears
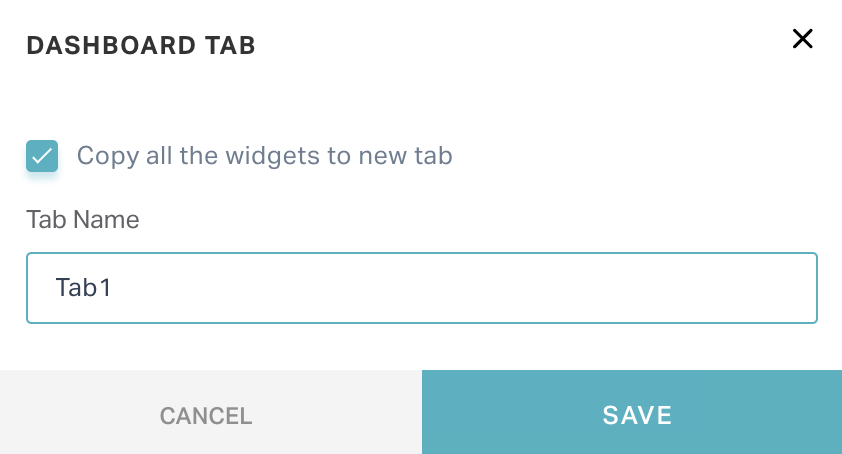
Click SAVE. Now the existing dashboard will be configured as a separate tab.
Click the
 (Tab Manager) icon. The Tab Manager dialog appears as shown below.
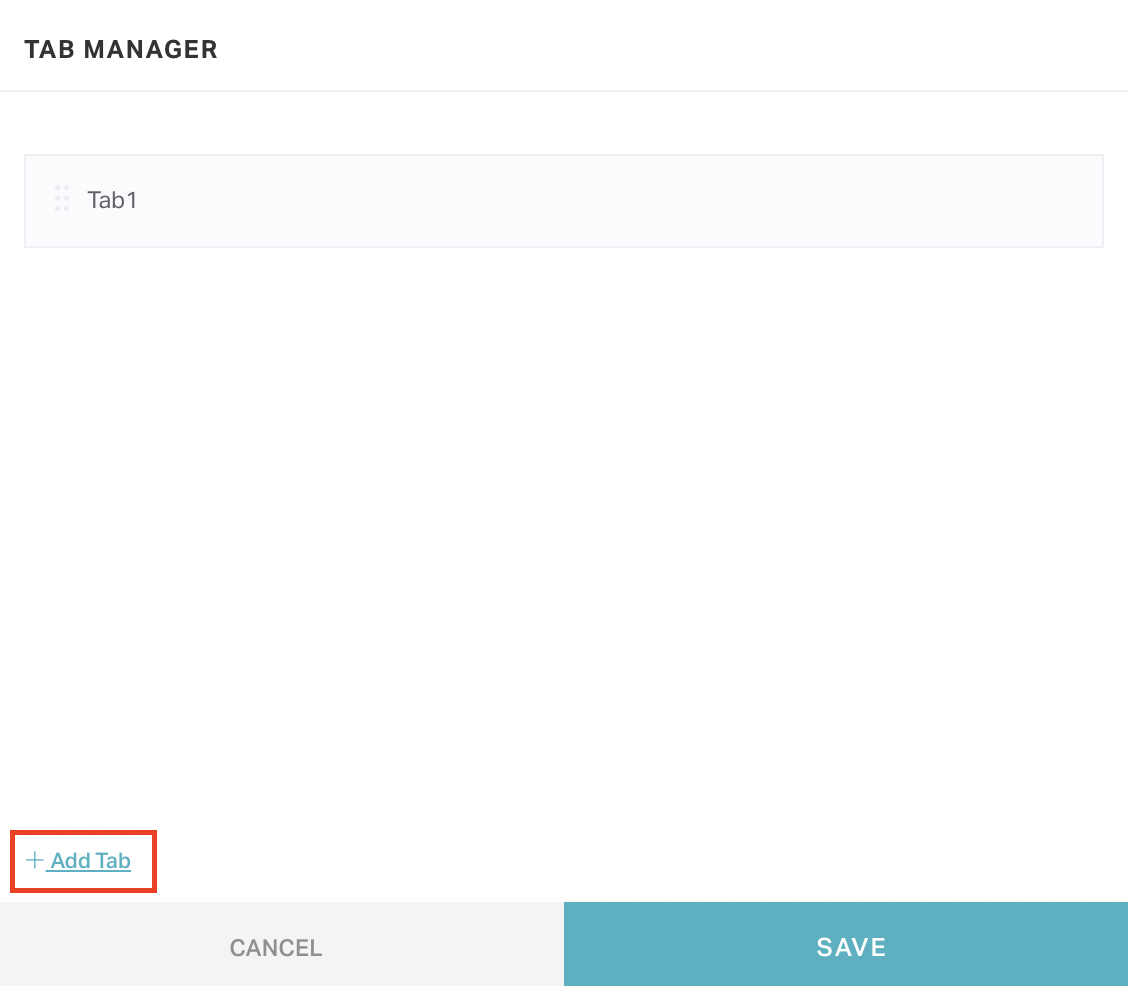
Click Add Tab

Provide the new Tab Name and click ADD. The new tab is now added to the TAB MANAGER.
Click SAVE. New tab is now displayed in the dashboard.
Click SAVE at the top right of the dashboard to save all the changes made.
Navigate to the new tab and click
 . You can now configure the widgets for the dashboard as required. Read the Creating Dashboards section for more information.
Note: Alternatively, you can click the
(vertical ellipsis) icon at the top right of the dashboard and click Edit to configure the dashboard.
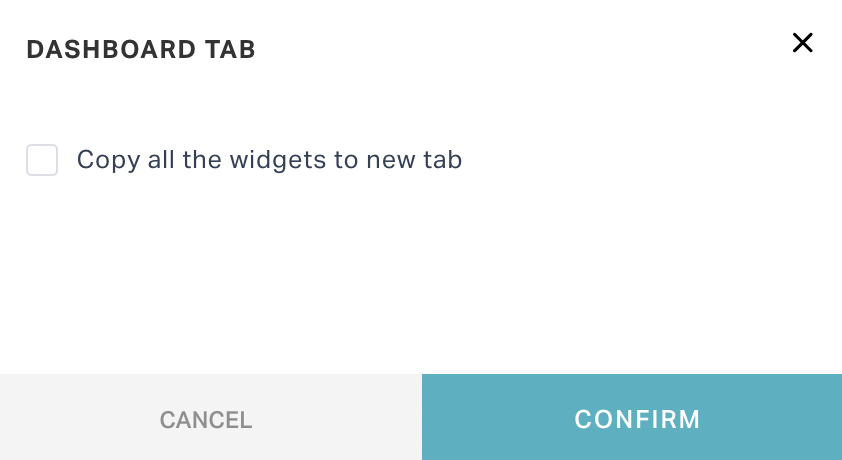
If you turn off the Tabs toggle button (that is, decide to remove the tabs in the dashboard) in the Tab Options window, you can choose the tab whose widgets must be copied to the main dashboard as shown below.
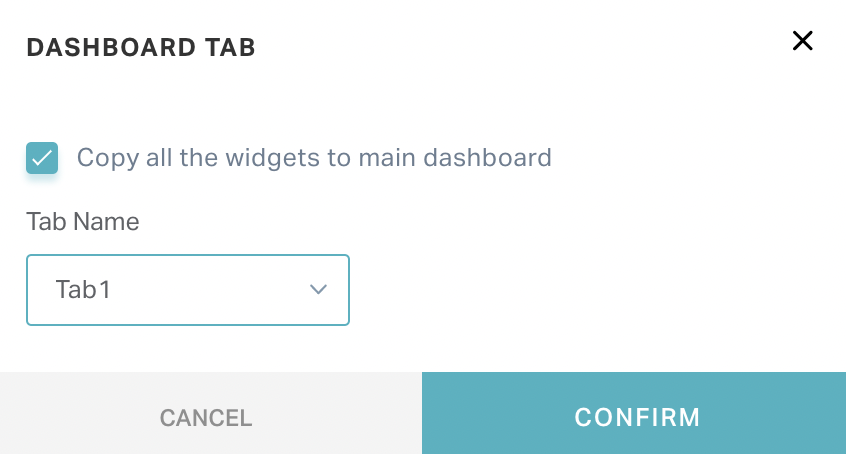
Note: If you click CONFIRM in the above window without checking Copy all the widgets to main dashboard field, the dashboard will appear empty.
Configuring Dashboard Settings
To configure the settings of existing dashboards,
Click the
(dashboard) icon and then click the (hamburger) icon at the top left of the dashboard header. The DASHBOARDS panel is displayed as shown below.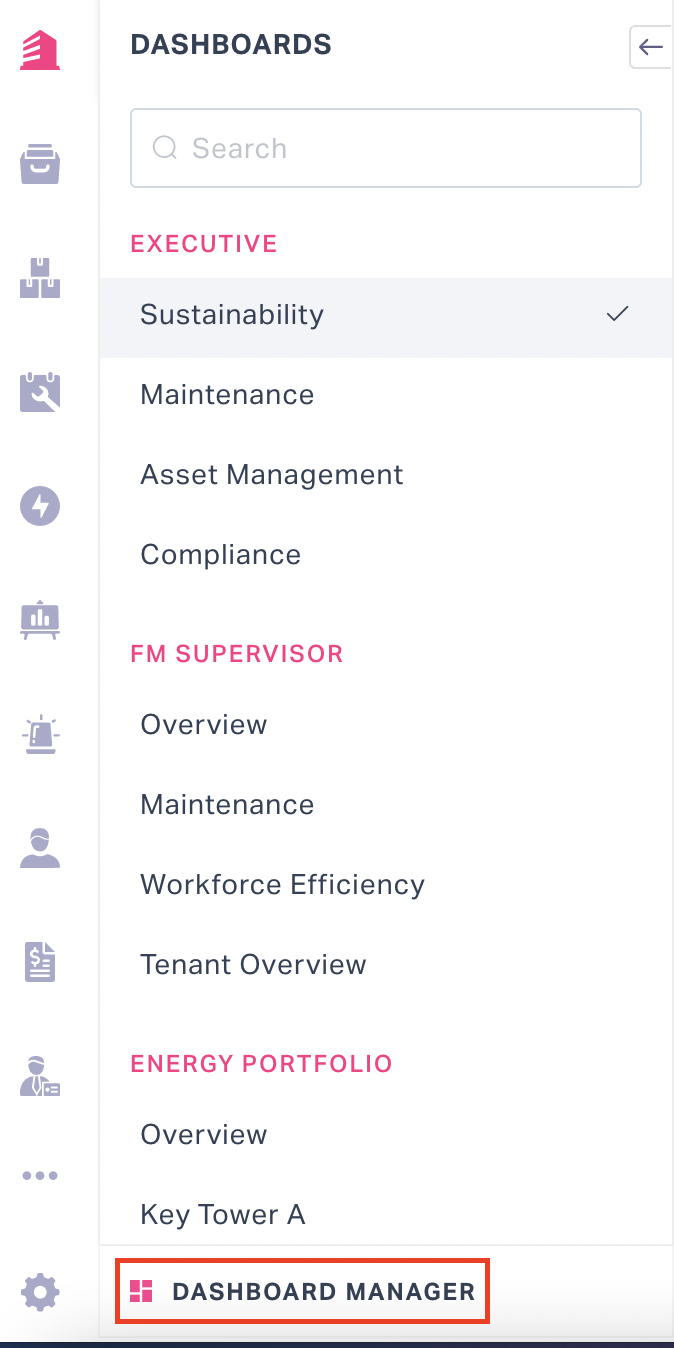
Click the DASHBOARD MANAGER link at the bottom of the panel. The Dashboard Manager screen appears as shown below.
Note: Alternatively, you can access the Dashboard Manager upon clicking the
(vertical ellipsis) icon at the top right of the dashboard.Note: The DASHBOARD section is displayed by default.
If there are multiple user profiles associated with the account, select an user profile from the dropdown at the top of the screen to filter the corresponding folders.
Perform the required configurations to the existing dashboards from the following list:
Click and
drag icon corresponding to the folders or associated dashboards to reposition them.Click the
(edit) icon corresponding to the folder to rename it.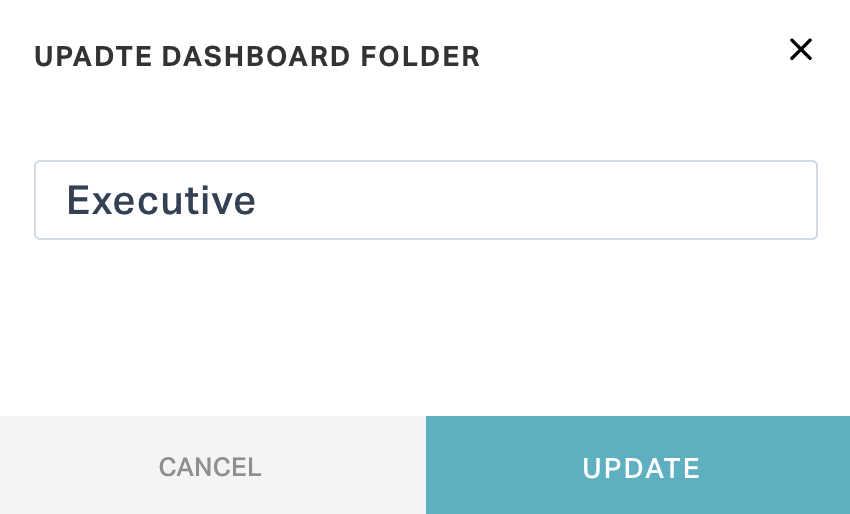
Click the
(share) icon corresponding to the dashboard to control who can access the dashboard.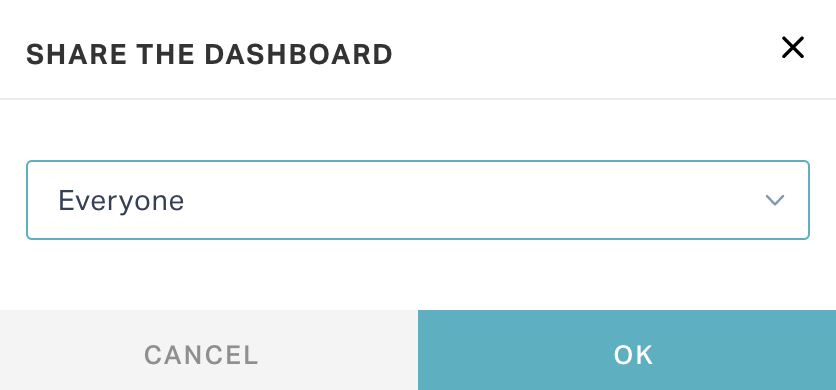
Note: All dashboards are shared with everyone by default.
Click the
 (publish to portal) icon corresponding to the dashboard to publish it to the selected portal users.
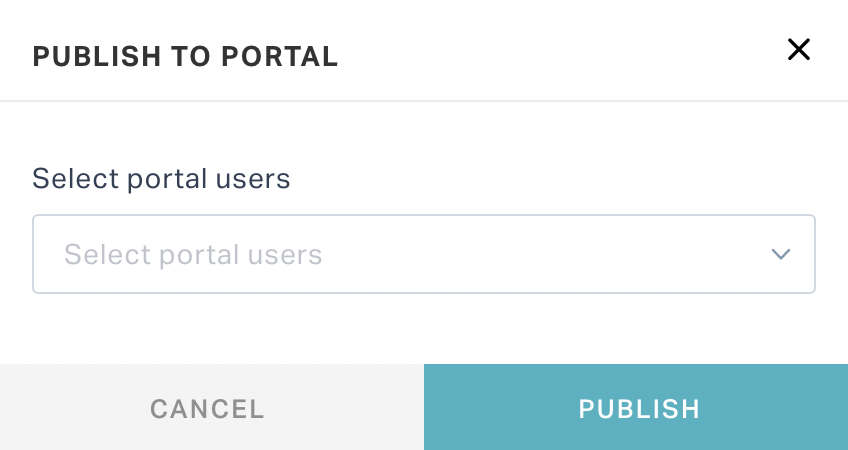
Click the
(vertical ellipsis) icon corresponding to the dashboard and then click Enable/Disable Mobile Dashboard to enable or disable the dashboard in mobile view.
Note: The Share, Publish to Portal and Enable/Disable Mobile Dashboard operations can also be performed from the home screen, upon clicking the
(vertical ellipsis) icon at the top right.Click
at the top left to navigate to the previous screen. The DASHBOARDS panel is now updated with the latest configurations.
Modifying Dashboards
To make changes to an existing dashboard,
Click the
(vertical ellipsis) icon at the top right of the dashboard and Edit.The dashboard appears in editable mode as shown below.
Note: Alternatively, you can edit the dashboard upon clicking the
(vertical ellipsis) icon corresponding to the dashboard in the Dashboard Manager.Perform the required modifications explained below:
Modify the name of the dashboard and also move it to another folder, as required.
Click the
 (Edit Dashboard Tabs) icon to configure multiple tabs in a dashboard. Read the Configuring Multiple Tabs section for more information
Click
 to add more widgets to the dashboard. Read the Creating Dashboards section for information on how to configure the widgets.
Click SAVE or CANCEL to save or cancel the changes, respectively.
You can make changes to the individual components of a dashboard.
Modifying Filters and Timelines
To make changes to an existing filter,
Click the
(vertical ellipsis) icon at the top right of the dashboard and select Configure filters.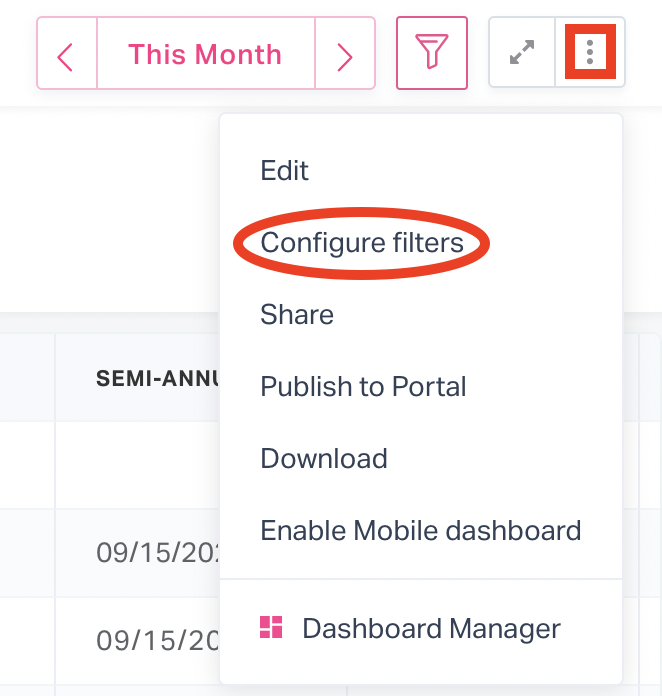
The available filter(s) are displayed in the filters panel as shown below.
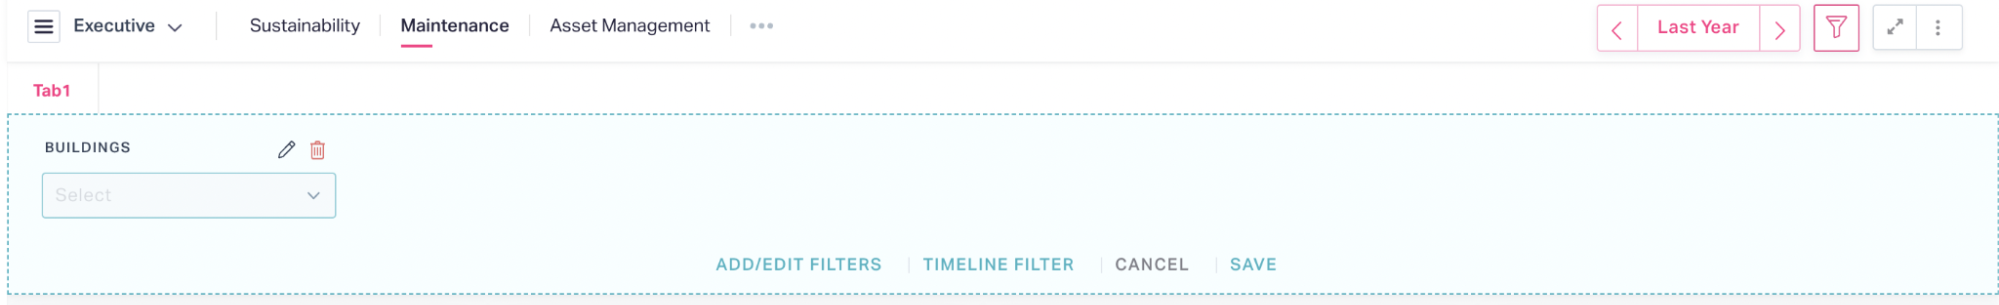
Perform the required modifications. The scope of modifications are listed below:
Add or remove filters in the dashboard upon clicking ADD/EDIT FILTERS.
Configure the default selection and the options to be displayed in the filter. To configure the filter settings,
Hover the required filter and click the
 (edit) icon. The respective FILTER CUSTOMIZATION screen appears as shown below
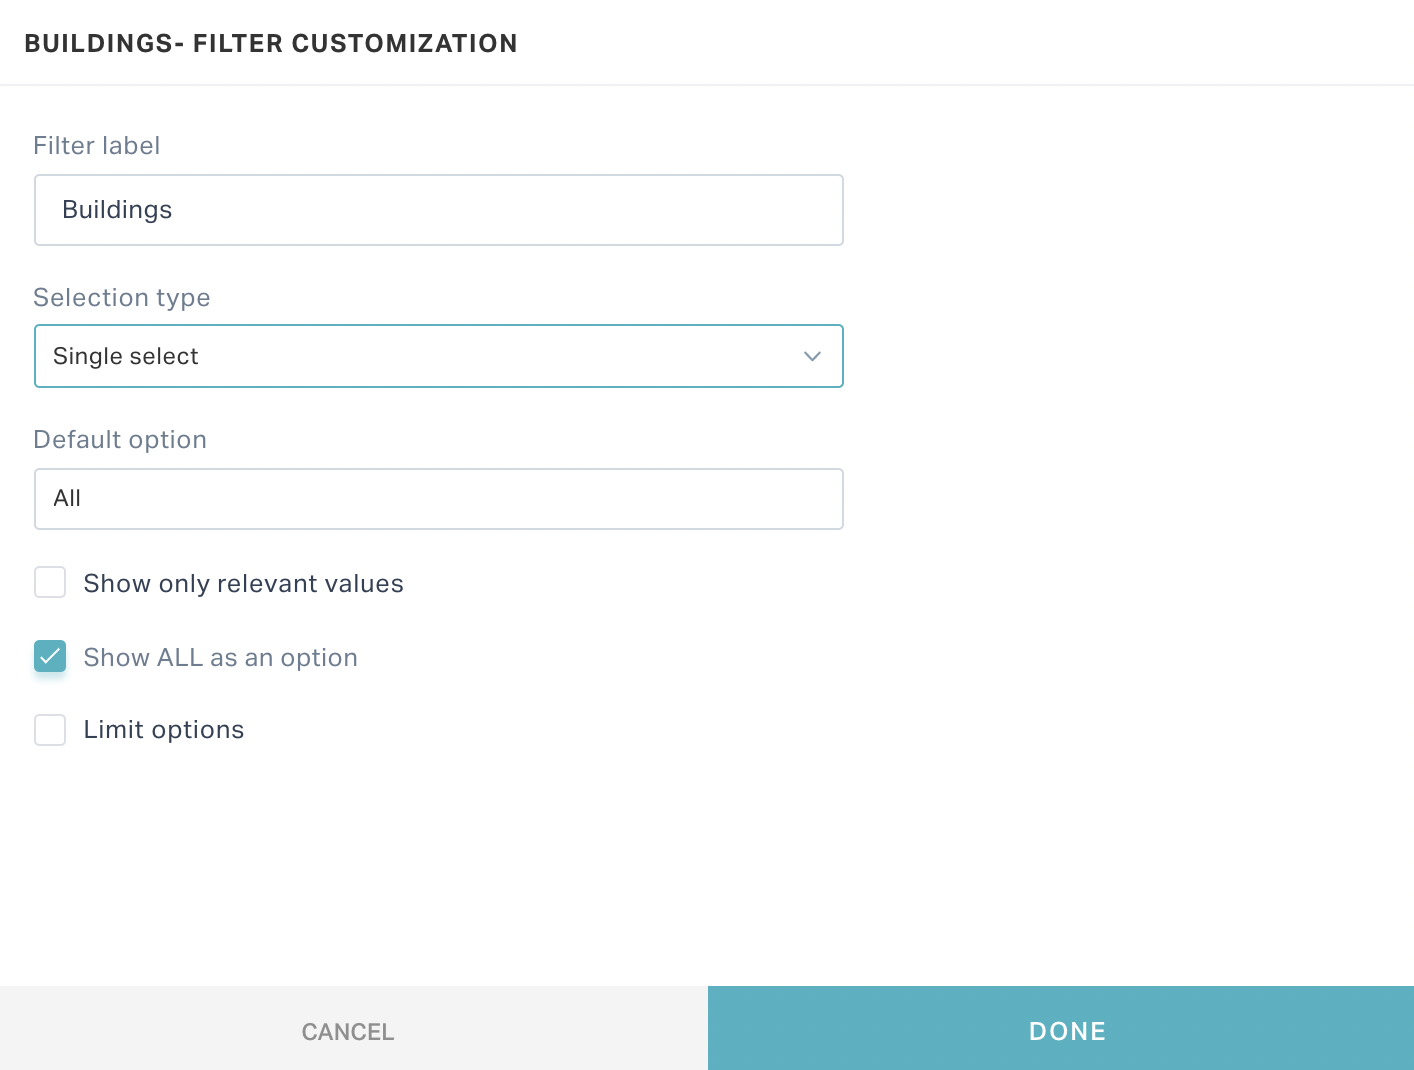
Update the following fields.
Field Description Filter label The name of the filter Selection type The selection type for the Default option field (to configure the field to be single or multi-valued). You can choose from the following options: - Single select
- Multi select
Default option The filters to be applied by default.
Note: This field is set to All by default.Show only relevant values The check box to determine the values to be displayed in the Default option field. Show ALL as an option The check box to add ‘All’ as an option in the Default option dropdown.
Note: This field is checked by default.Limit options The check box to customize the values to be displayed in the Default option field. Additional fields are displayed if this field is checked. Note: You can configure multiple criteria as shown above. Upon checking this field, the Shows ‘Others’ option field is selected by default, that is, ‘Others’ is added as an option in the Default option dropdown.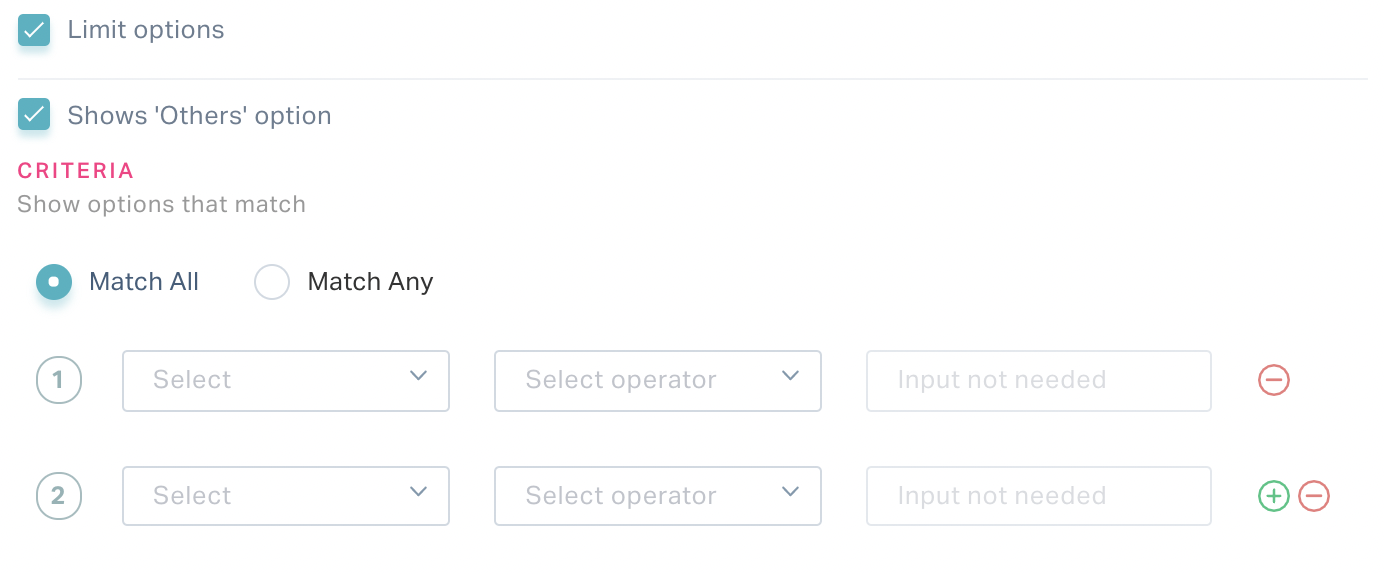
Click DONE. You will return to the filter panel.

Click SAVE. The default selection and the options to be displayed in the filter are now updated.
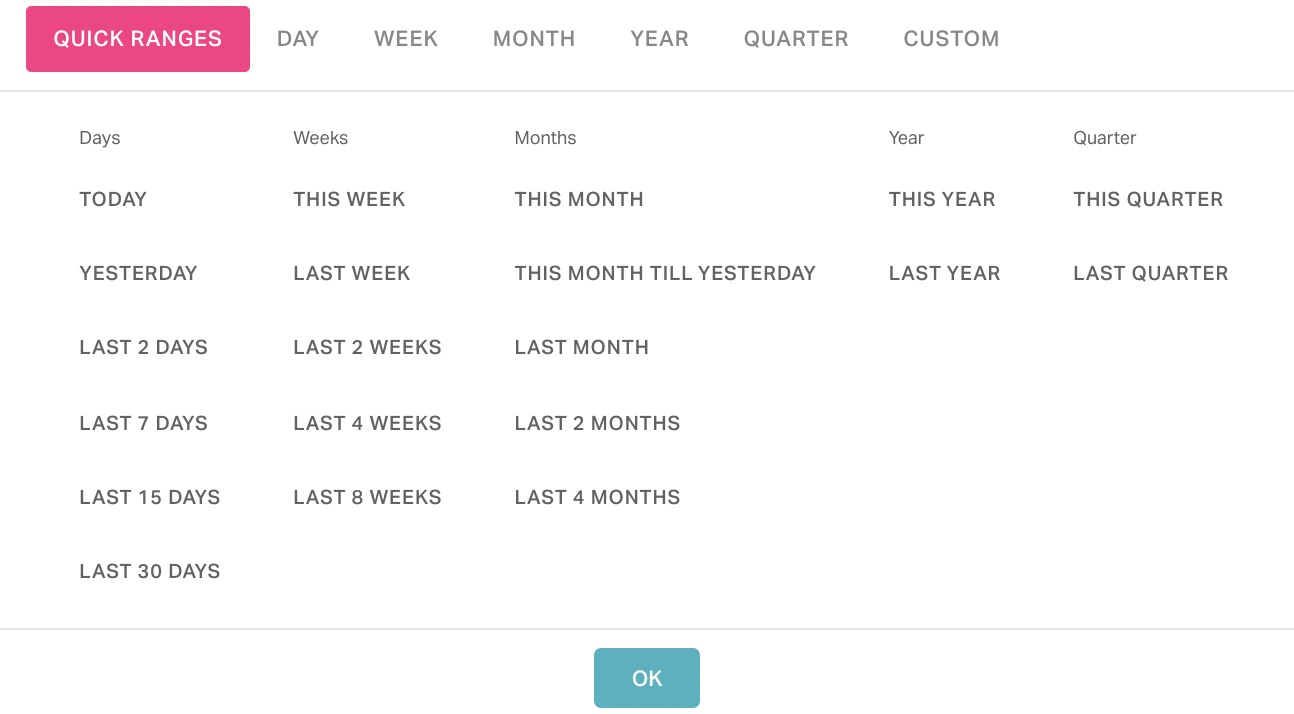
Configure the default timeline filter (for example, this year, last month and so on) for the dashboard upon clicking TIMELINE FILTER.
Modifying Widgets
To make changes to a configured widget,
Click the
(vertical ellipsis) icon at the top right of the dashboard and Edit.The dashboard appears in editable mode as shown below.
Note: Alternatively, you can edit the dashboard upon clicking the
(vertical ellipsis) icon corresponding to the dashboard in the Dashboard Manager.Perform the required modifications explained below:
Click and drag the
 icon at the bottom corner to resize the widget.
Click and drag the widget itself to reposition it.
Click the
 (horizontal ellipsis) icon at the top right of the widget and perform any of the following actions:
Select Edit to modify the associated details. Read the Creating Dashboards section for more information on widget details.
Select Duplicate to create a copy of the widget in the dashboard
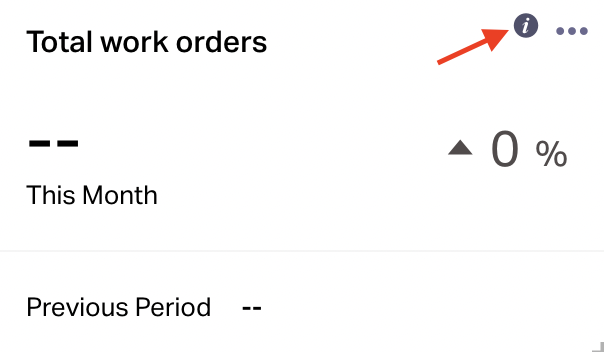
Select Help text to provide help text for the widget.
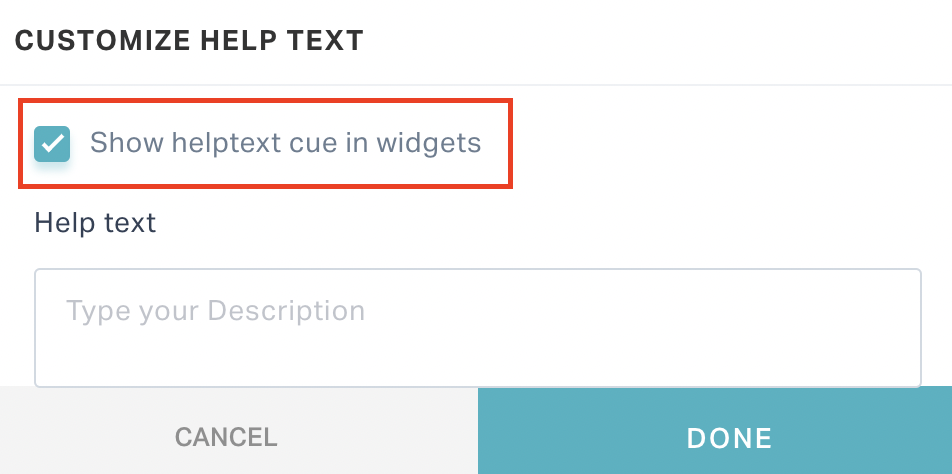
Note: If you check Show help text cue in widgets in the CUSTOMIZE HELP TEXT window shown above, a small icon will appear in the widget, clicking which will display the help text.
Configure filters and timelines to obtain various views of the indicators in the widget.
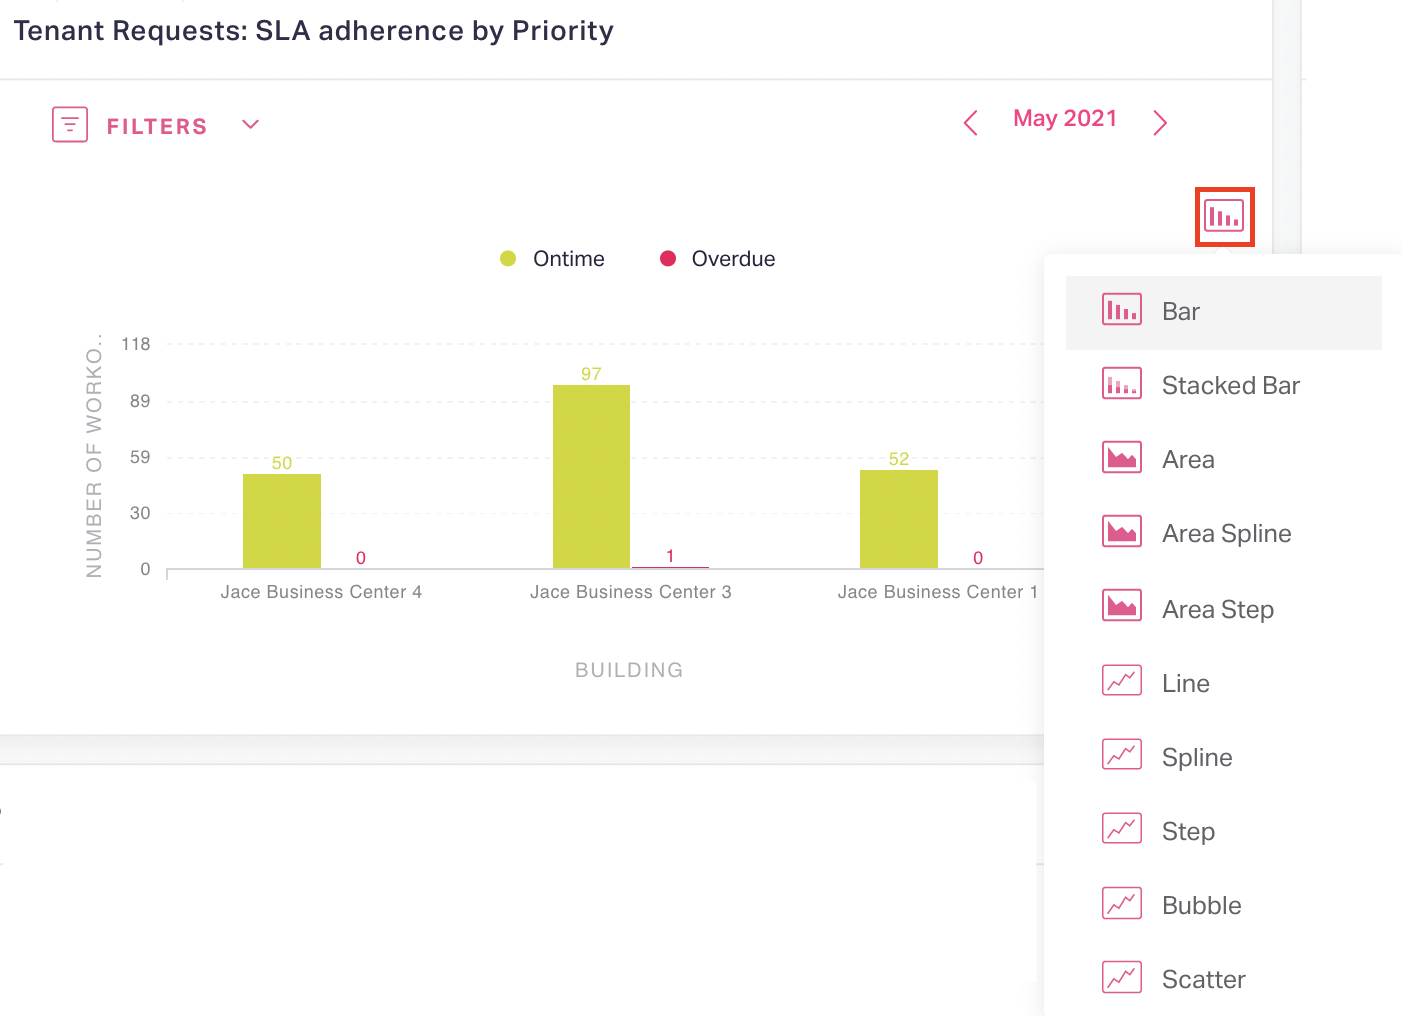
Modify the chart type associated with the widget.
Deleting Dashboards
To delete a dashboard,
Click the
(dashboard) icon and then click the (hamburger) icon at the top left of the dashboard header. The DASHBOARDS panel is displayed as shown below.Click the DASHBOARD MANAGER link at the bottom of the panel. The Dashboard Manager screen appears as shown below (The DASHBOARD section is displayed by default).
Note: Alternatively, you can access the Dashboard Manager upon clicking the
(vertical ellipsis) icon at the top right of the dashboard.If there are multiple user profiles associated with the account, select the required user profile from the dropdown at the top of the screen, to filter the dashboards.
Click the folder or the respective
 (chevron) icon to display the available dashboards in it.
Click the
icon corresponding to the required dashboard to delete it. The Delete Dashboard window appears as shown below.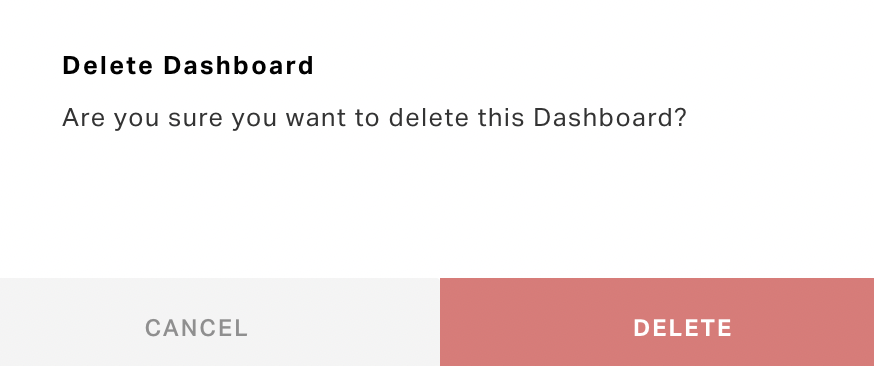
Click DELETE. The dashboard is deleted from the folder.
Click
at the top left to navigate to the previous screen. The deleted view is now removed from the DASHBOARDS panel.
Note: You cannot directly delete a folder that contains dashboards in it. The ![]() icon will be displayed only for empty folders.
icon will be displayed only for empty folders.
You can also delete the individual components of the dashboard.
Deleting Tabs
To delete a tab in a dashboard,
Click the
(hamburger) icon at the top left of the dashboard header. The DASHBOARDS panel is displayed as shown below. (dashboard) icon and then click theSelect the required dashboard from the DASHBOARDS panel.
Click the
(vertical ellipsis) icon at the top right of the dashboard and then click Edit. The dashboard appears in editable mode as shown below.Click the
(Tab Manager) icon. The Tab Manager dialog appears as shown below.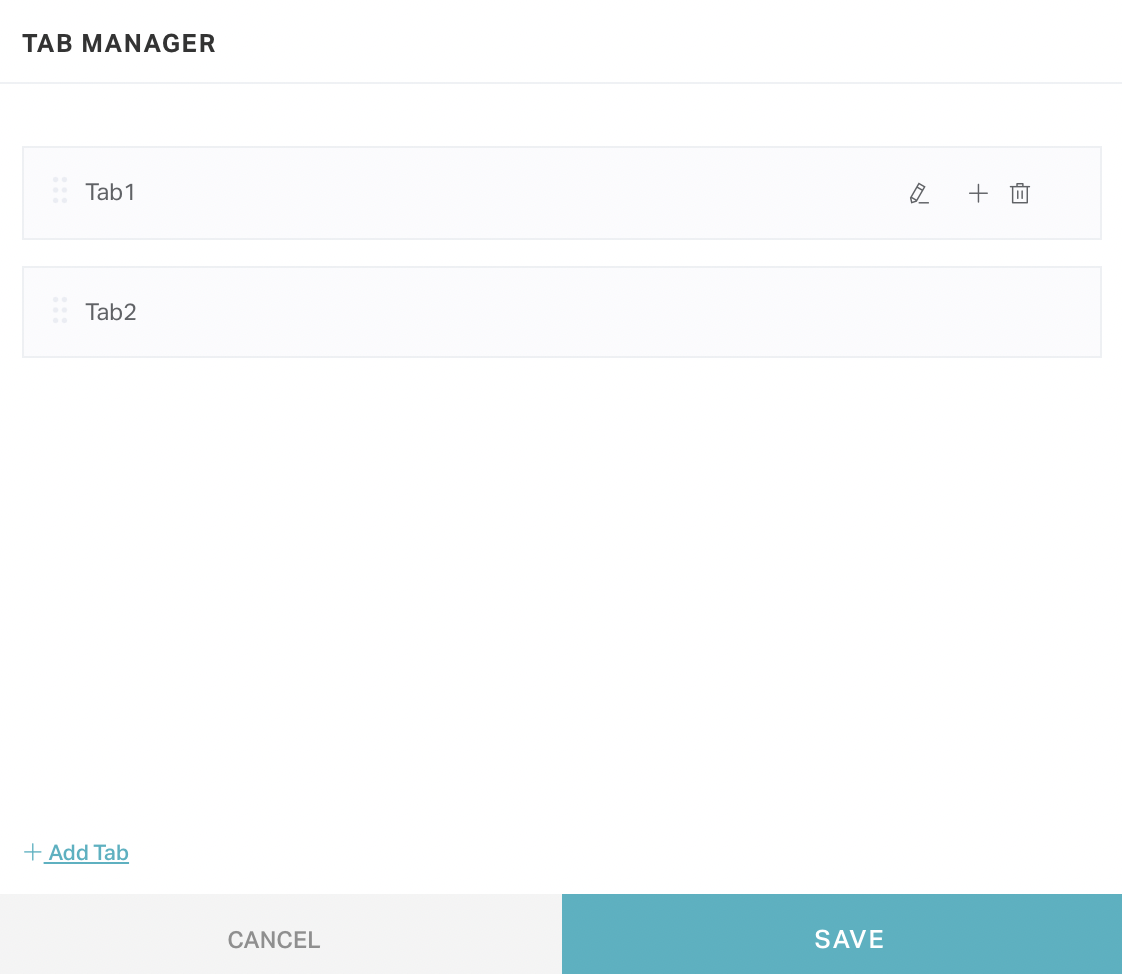
Note: The positioning of the icon depends on the Tab Position configuration (that is, Top or Left). Read the Configuring Multiple Tabs section for more information.
Click the
 (delete) icon respective to the tab that you want to delete. A success message appears to confirm that the tab is deleted.
Note: The
(Tab Manager) icon is displayed, only if at least one tab is configured in the dashboard.
Deleting Filters and Timelines
To delete a filter or timeline from the dashboard,
Click the
(vertical ellipsis) icon at the top right of the dashboard and select Configure filters.The available filter(s) are displayed in the filters panel as shown below.

Remove the unnecessary filter configurations. You can delete the following items:
- Filter - You can delete a filter in the following ways:
- Hover over the filter and click the
 icon.
icon. - Click ADD/EDIT FILTERS and click the
 icon respective to the filter in the SELECTED FILTERS section.
 - Timeline - Click TIMELINE FILTER and then uncheck Enable Timeline Filter field in the DASHBOARD FILTERS window.
- Hover over the filter and click the
- Click SAVE in the filters panel to save all the updates.
Deleting Widgets
To delete a widget in a dashboard,
Click the
(dashboard) icon and then click the (hamburger) icon at the top left of the dashboard header. The DASHBOARDS panel is displayed as shown below.Select the required dashboard from the DASHBOARDS panel.
Click the
(vertical ellipsis) icon corresponding to the dashboard and then click Edit. The dashboard appears in editable mode as shown below.Click the
(horizontal ellipsis) icon at the top right of the widget and select Remove.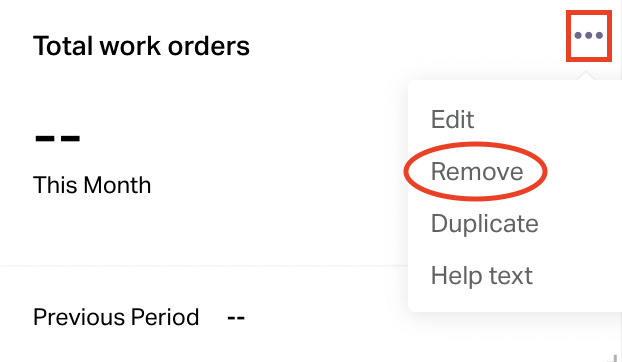
The widget is deleted from the dashboard.
Adding Screens
Click the
(dashboard) icon and then click the (hamburger) icon at the top left of the dashboard header. The DASHBOARDS panel is displayed as shown below.Click the DASHBOARD MANAGER link at the bottom of the panel. The Dashboard Manager screen appears as shown below (The DASHBOARD section is displayed by default).
Note: Alternatively, you can access the Dashboard Manager upon clicking the
(vertical ellipsis) icon at the top right of the dashboard.Navigate to the SCREENS section.
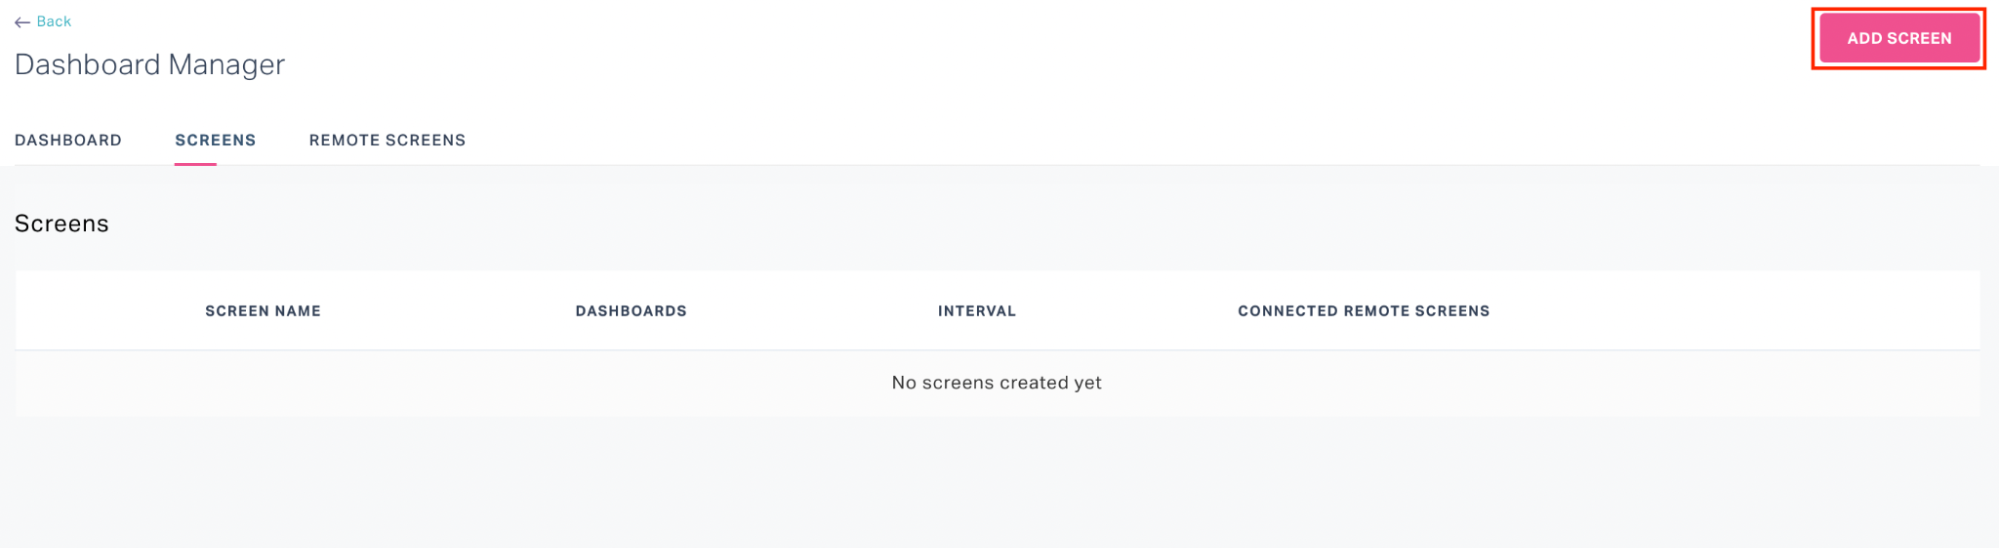
Click ADD SCREEN. The ADD SCREEN window is displayed as shown below.
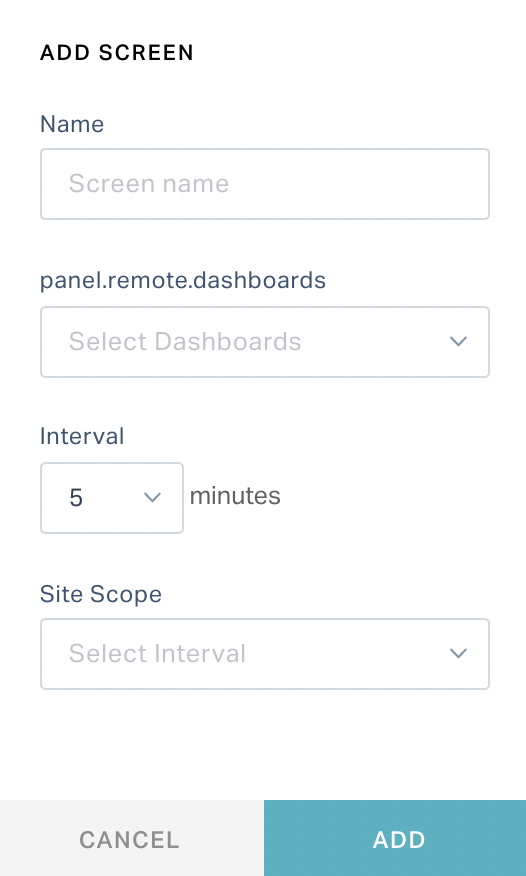
Update the following fields in this screen.
Field Description Name The name of the dashboard screen to be configured panel.remote.dashboards The dashboard(s) to be displayed in the remote screen(s). Note: This is a multi-value field. Interval The time interval at which the dashboards should switch in the remote screen Site Scope The scope of site for the screen being configured Click SAVE. The configured screen is displayed in the dashboard as shown below.
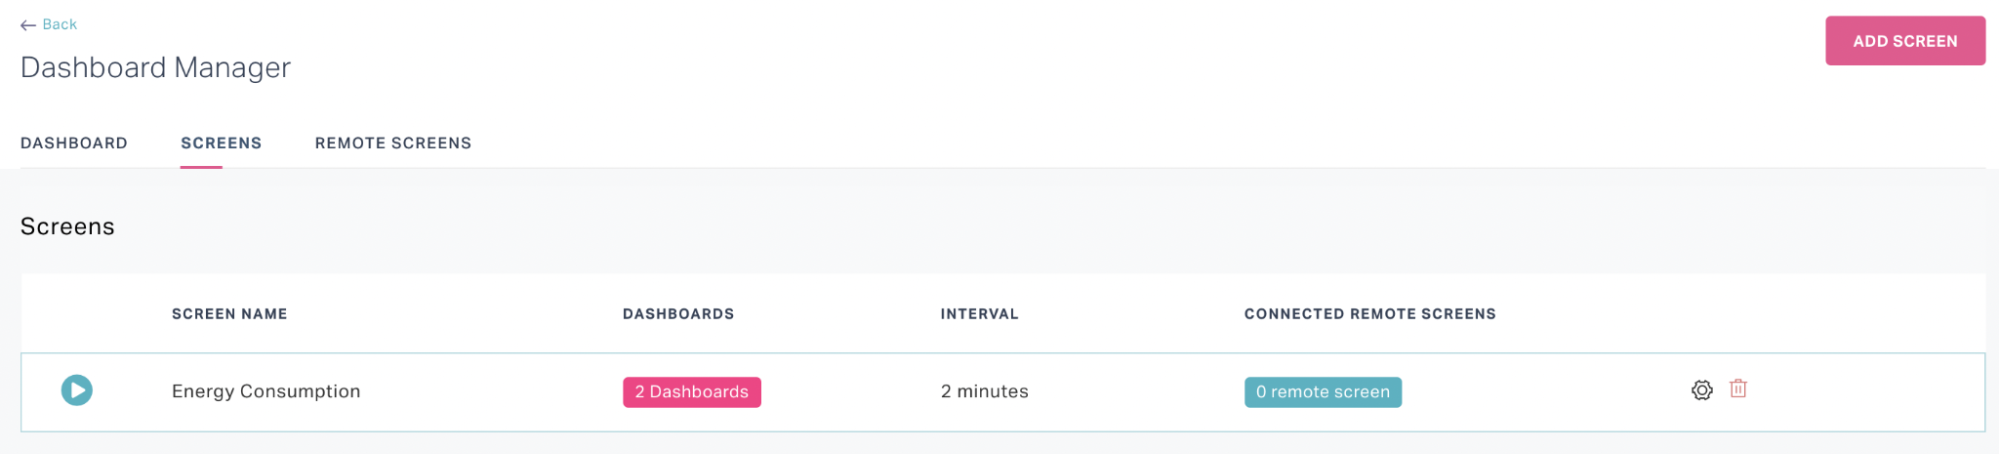
You can perform the following actions in this screen:
Click the
 (Launch) icon to launch the dashboard screen.
Click the
 (Edit) icon respective to the screen name to modify it.
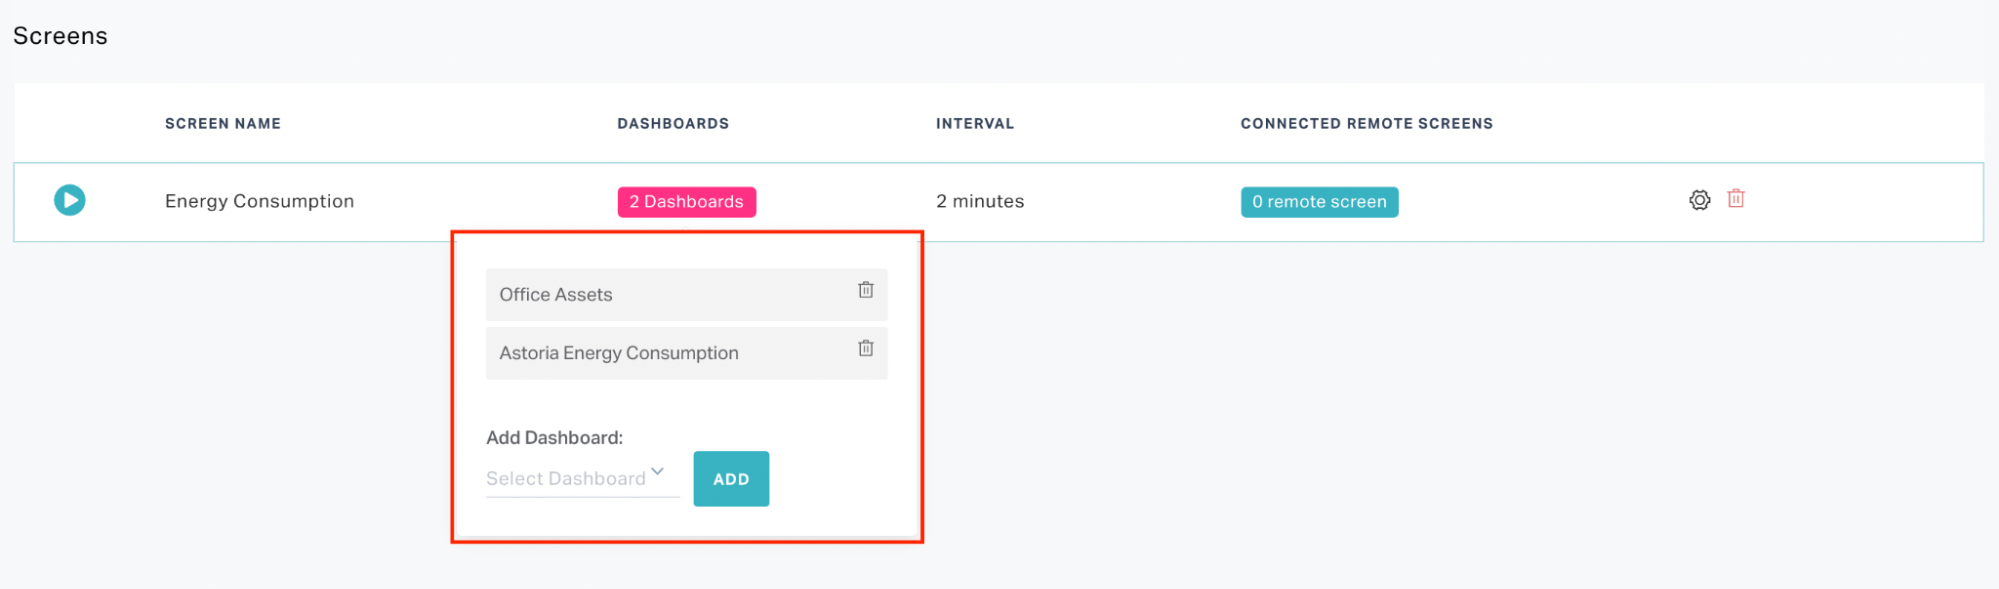
Click the number of dashboard(s) to add / delete dashboards on the screen.
Click the
(Edit) icon respective to the interval to modify it.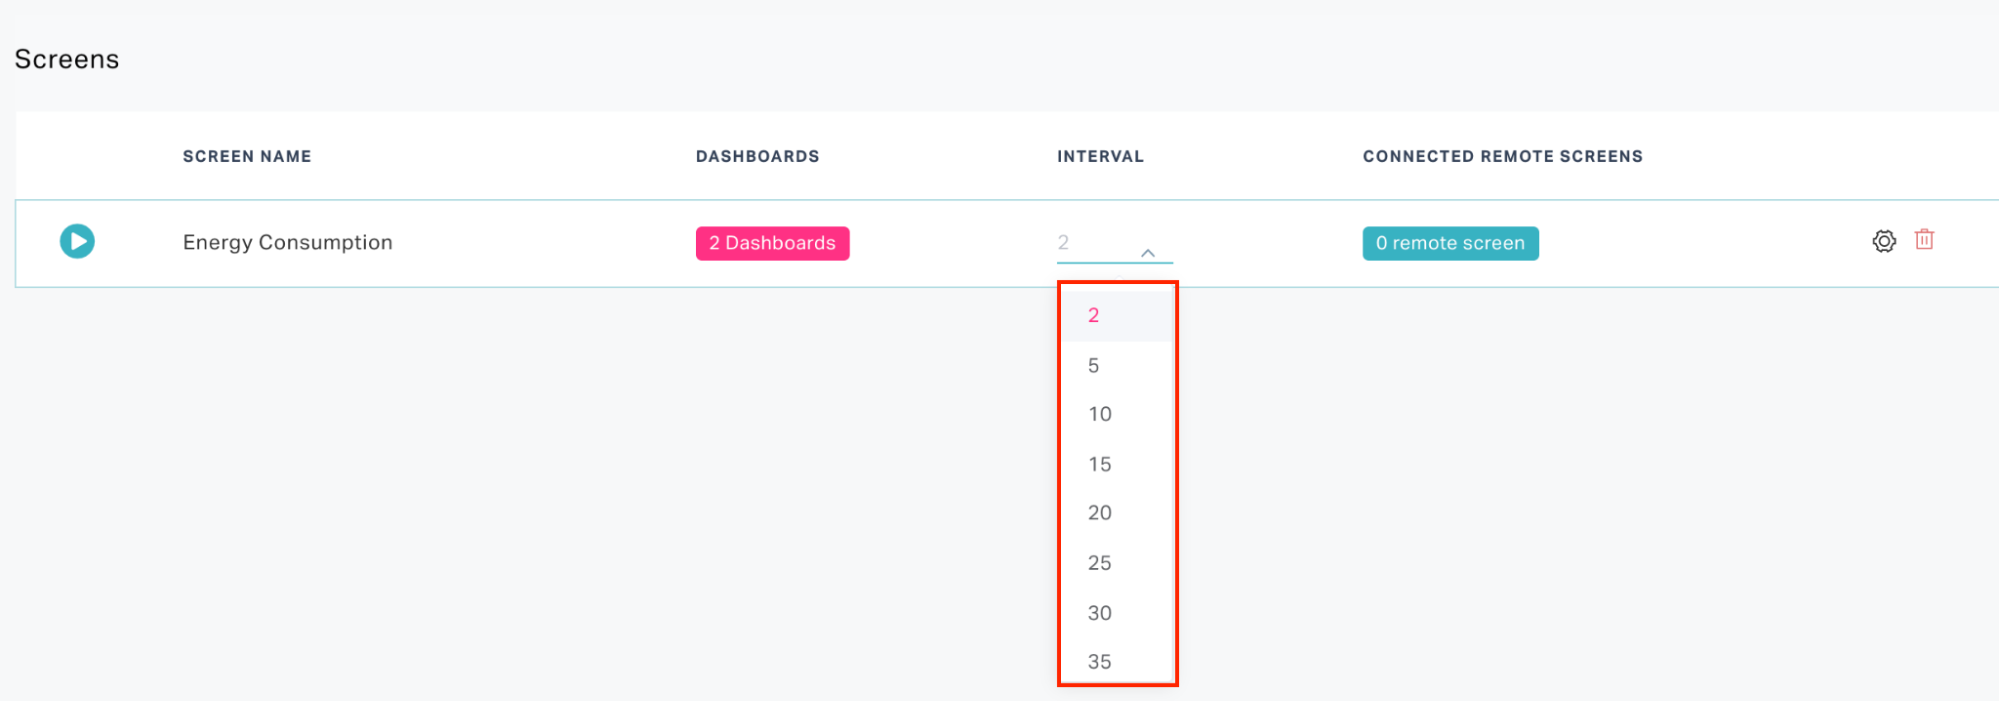
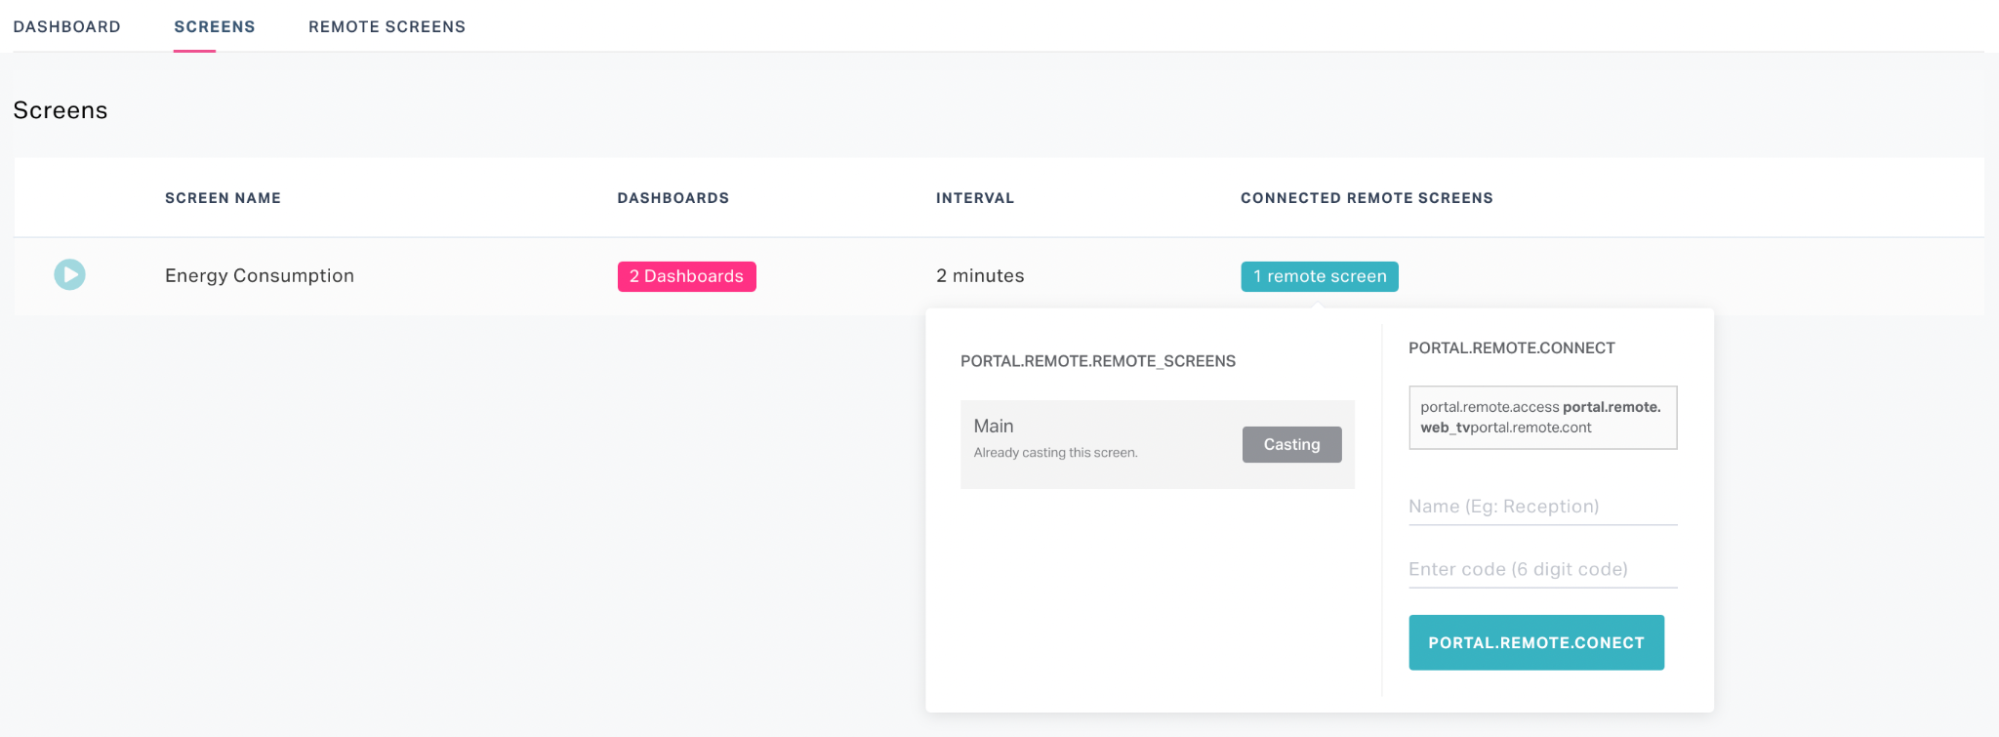
Click the number of remote screens to cast or uncast the dashboard in the respective screens.
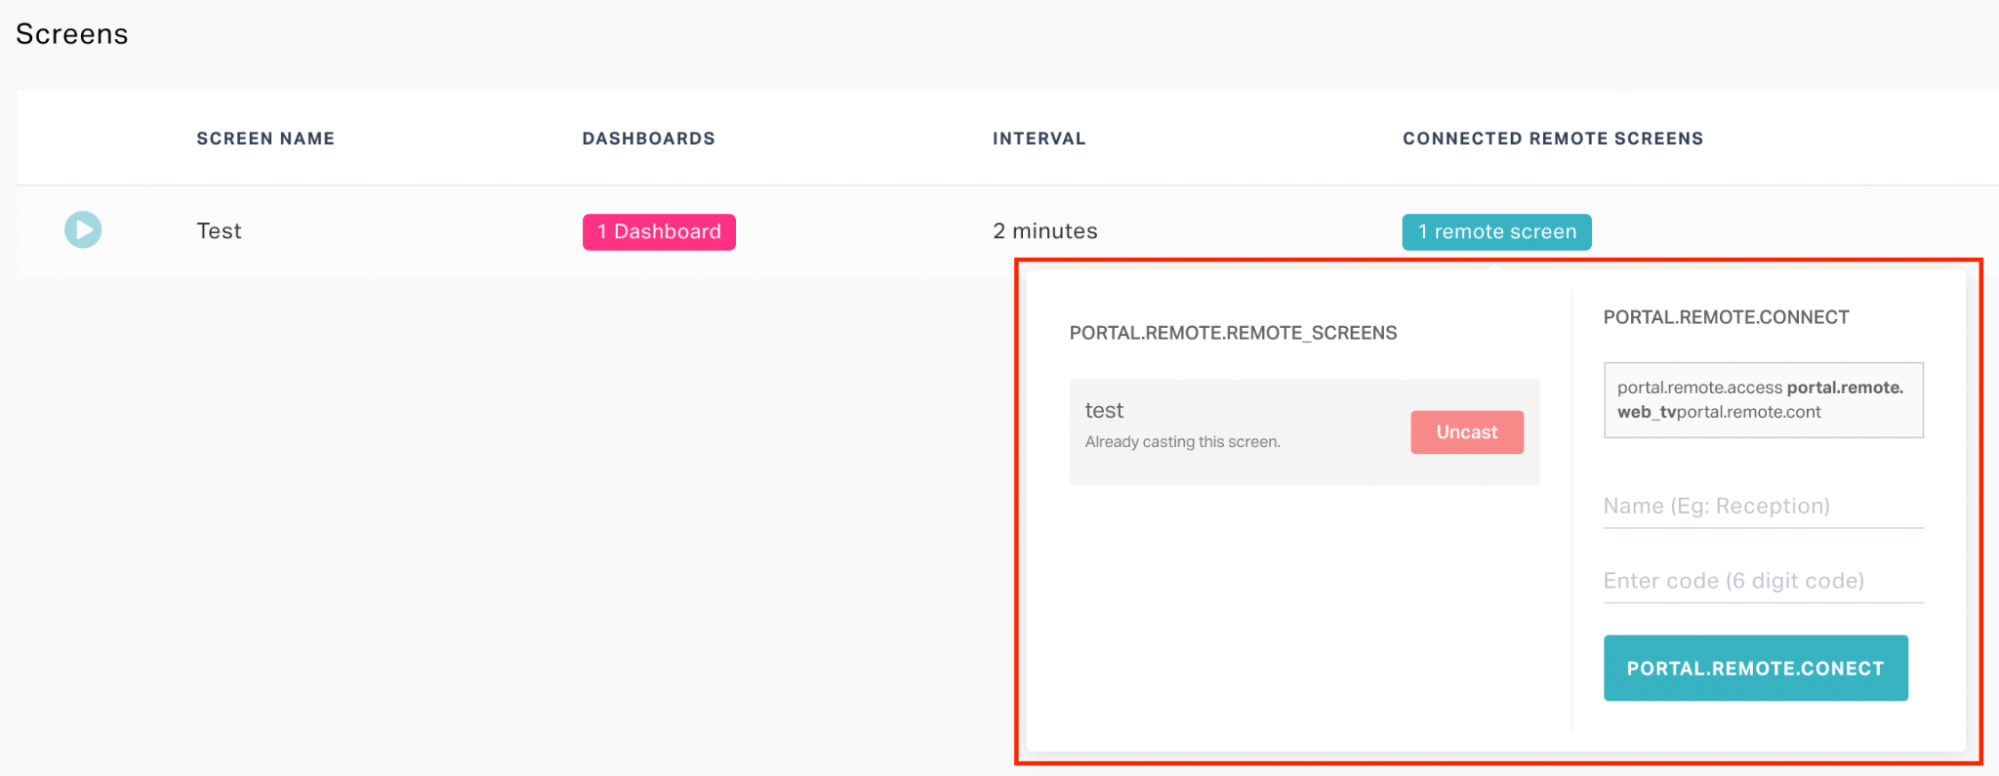
Read the Connecting Remote Screens section for more information.
Click
 icon respective to the screen to modify the site scope and choose to hide or show the dashboard title.
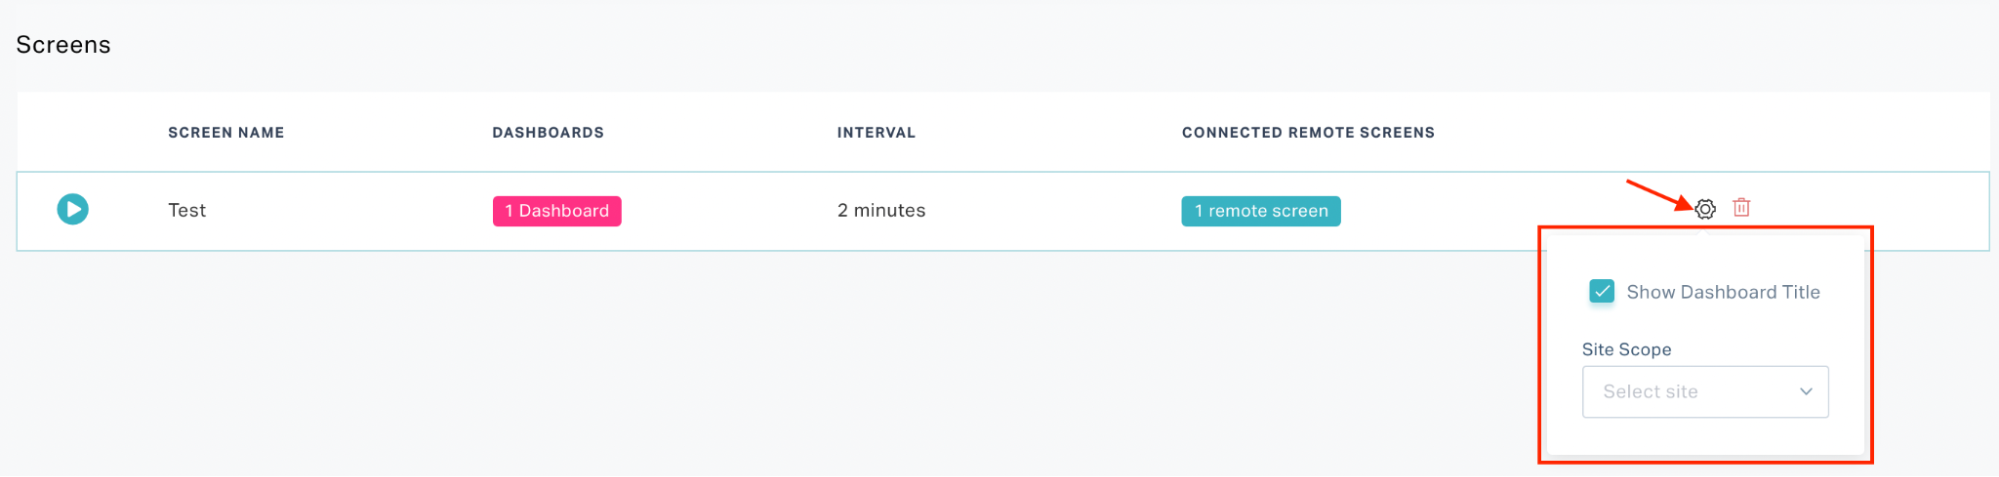
Click
 icon respective to the screen to delete it.
Connecting Remote Screens
To configure a remote screen to cast the dashboard,
Click the
(dashboard) icon and then click the (hamburger) icon at the top left of the dashboard header. The DASHBOARDS panel is displayed as shown below.Click the DASHBOARD MANAGER link at the bottom of the panel. The Dashboard Manager screen appears as shown below (The DASHBOARD section is displayed by default).
Note: Alternatively, you can access the Dashboard Manager upon clicking the
(vertical ellipsis) icon at the top right of the dashboard.Navigate to the REMOTE SCREENS section.
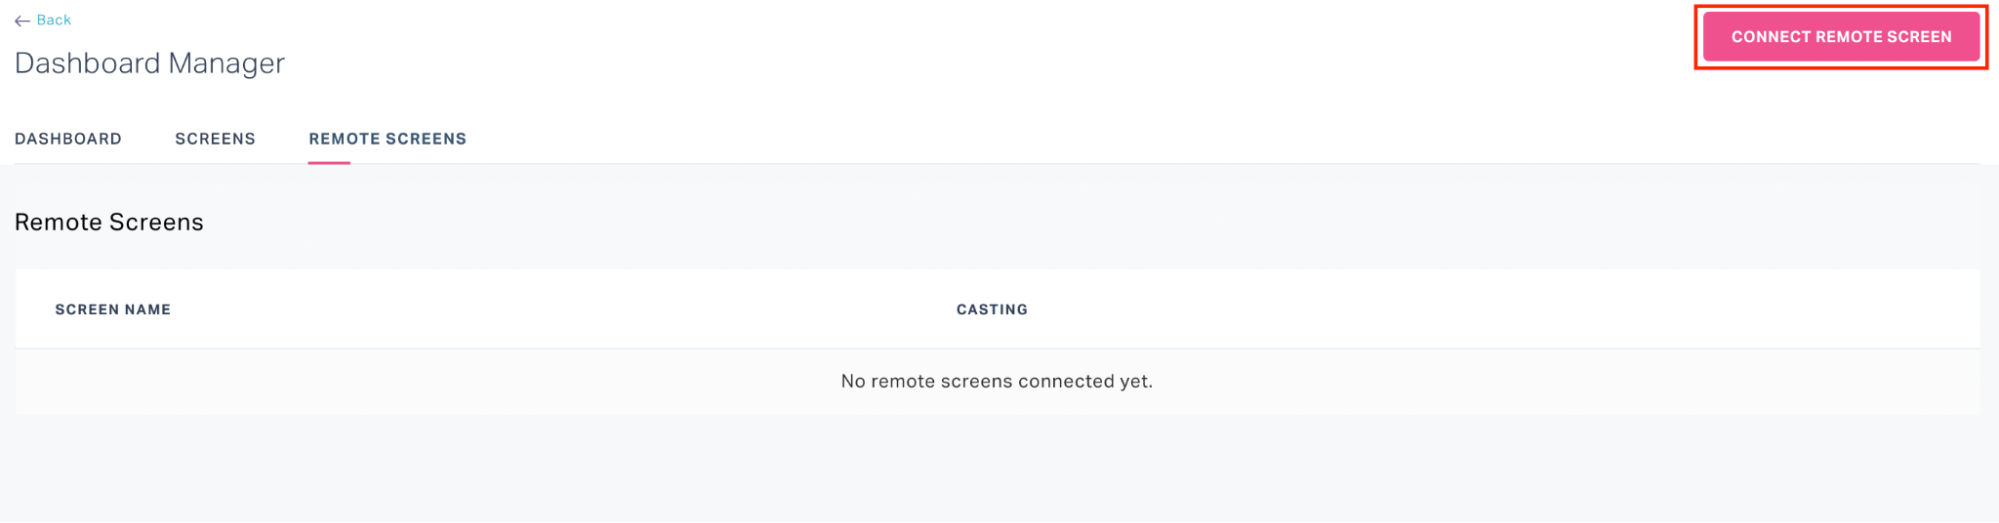
Click CONNECT REMOTE SCREEN. The CONNECT REMOTE SCREEN window is displayed as shown below.
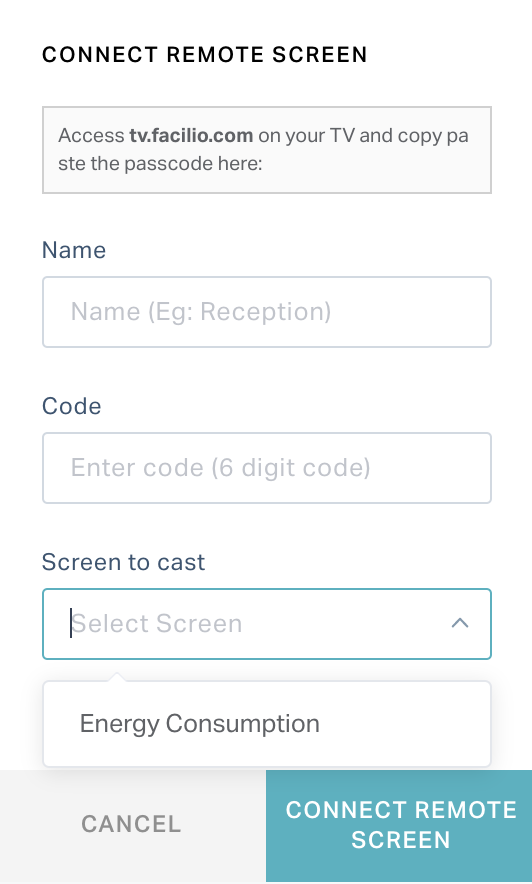
Access https://tv.facilio.com/tv on your TV. A passcode is displayed as shown below.

Update the following fields in this screen.
Field Description Name The name of the remote screen. Code The code displayed on the remote screen (for example, TV) Screen to cast The screen to be casted on the remote screen Click CONNECT REMOTE SCREEN. The remote screen is added to the dashboard as shown below.
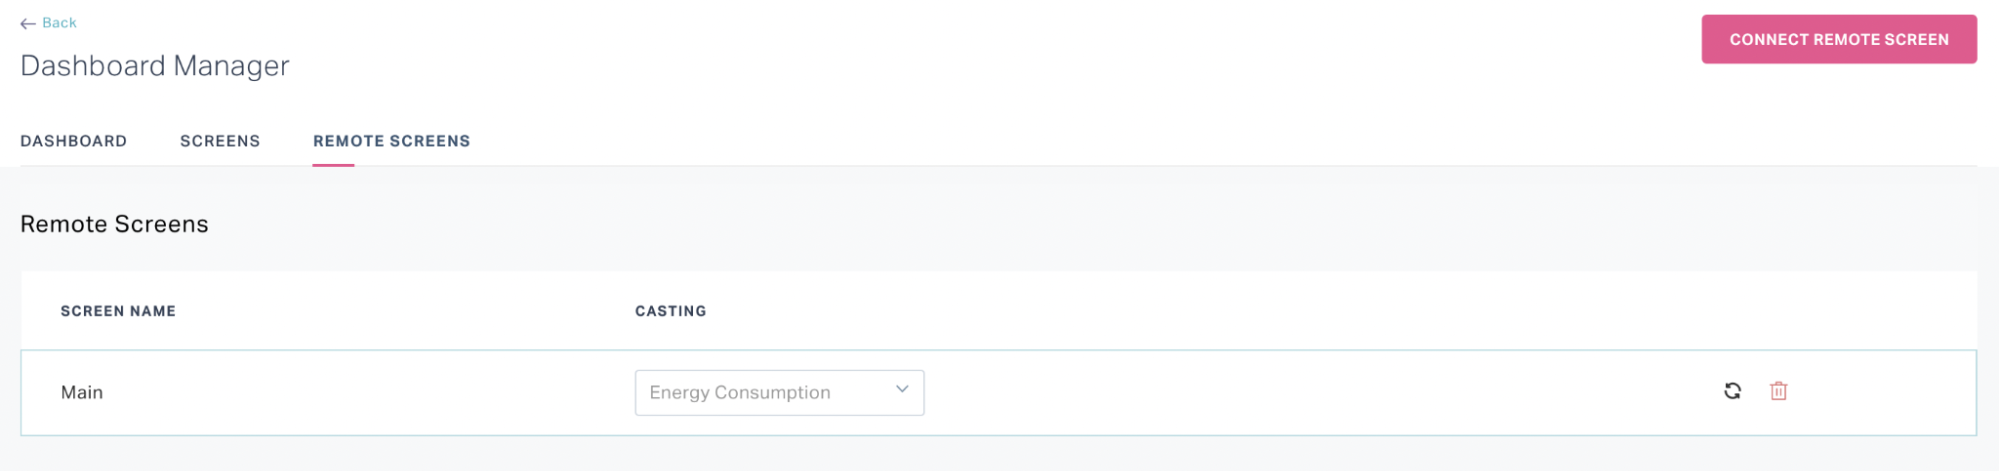
You can perform the following actions in this screen:
Click the
(Edit) icon respective to the screen name to modify it.Use the dropdown to switch the screen being casted.
Click the
 (refresh) for the changes to be reflected in the remote screen.
Click the
(delete) icon respective to the remote screen to delete it.Note: The remote screen configuration will be reflected in the SCREENS section as shown below.