Working with Pivot
The pivot table provides a flexible and dynamic way to process large datasets to obtain the desired reports. This enables users to conveniently view, examine, and perform advanced calculations on data. The pivot table helps redefine the entire table to obtain the data calculation with minimal effort in less time. In facility management, pivot tables streamline and analyze facility data such as assets, space, maintenance, energy, and cost. By leveraging pivot tables, facility managers can gain an intense understanding of facility operations, streamline data analysis, and make informed decisions to optimize resources and enhance efficiency. Using pivot, the readings of space, sites, assets, and connected buildings can be evaluated at row level.
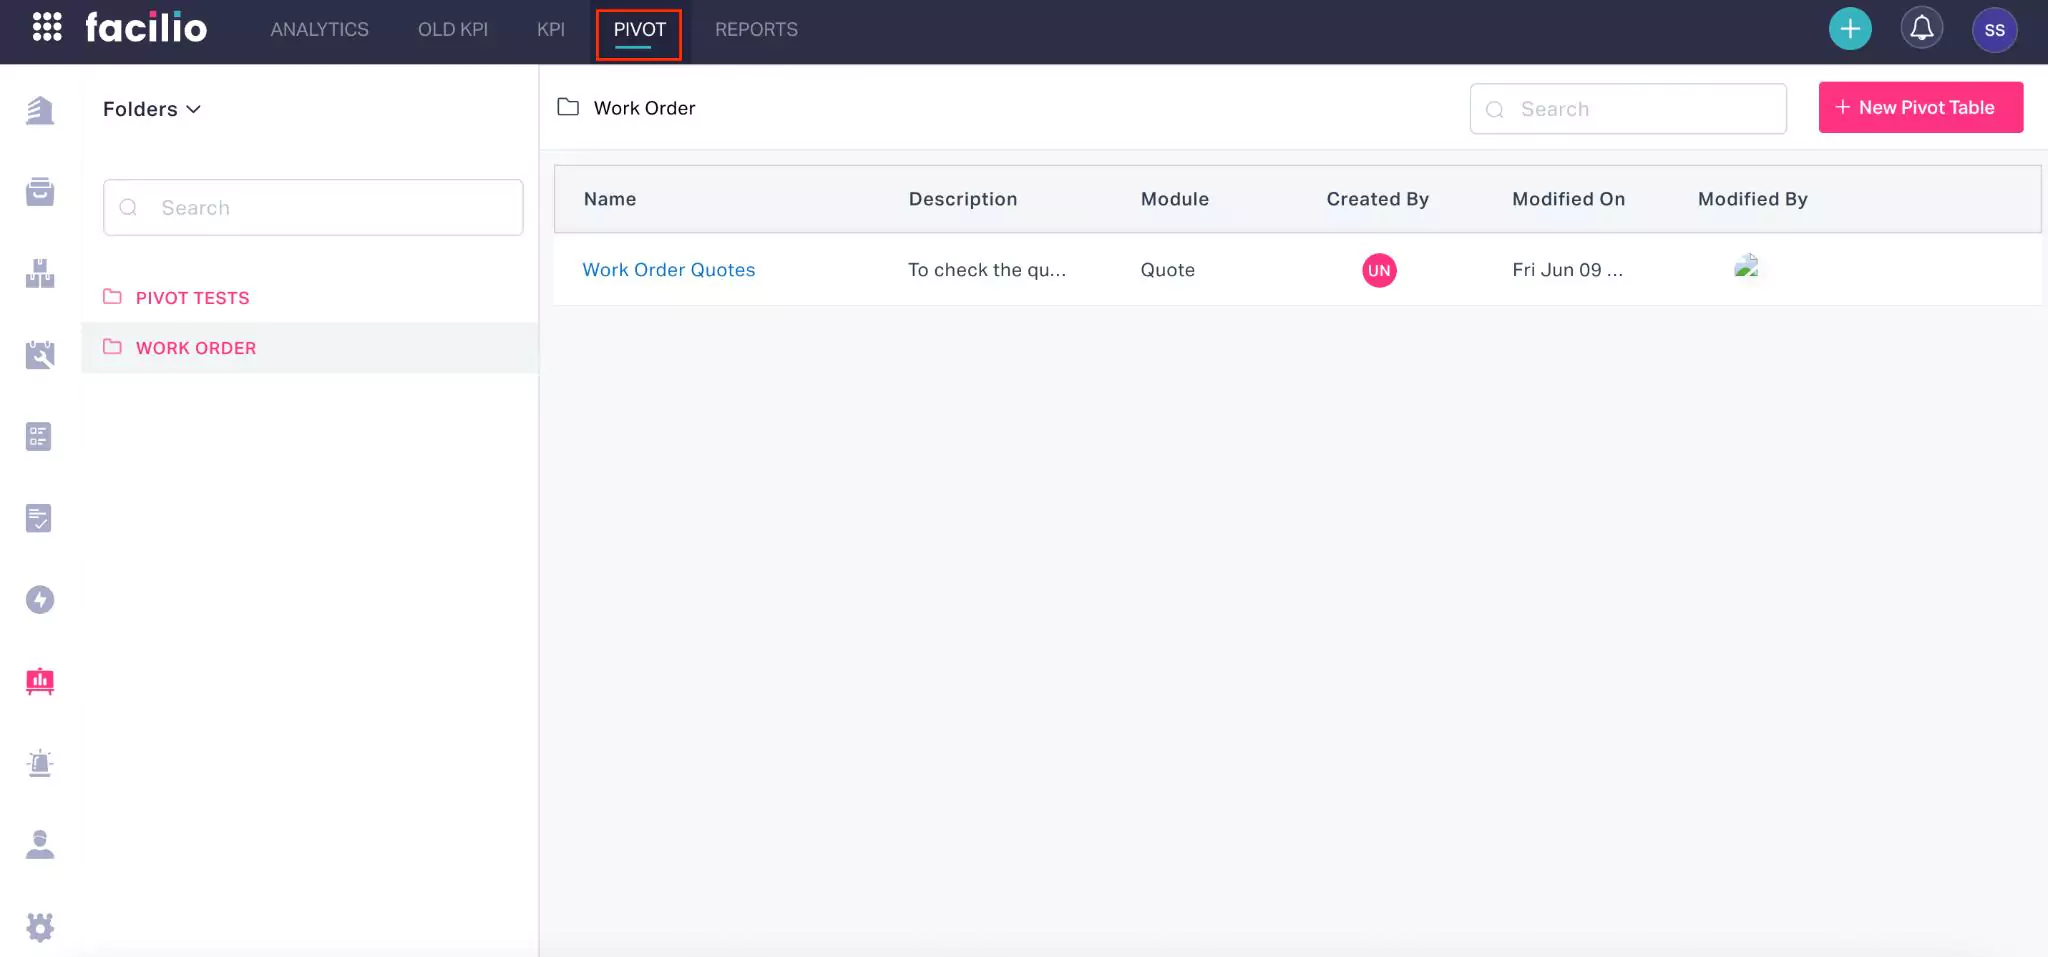
You can navigate to the PIVOT section of the Analytics module to summarize, sort, reorganize, or group the data stored in a table. The PIVOT configuration screen appears as shown below.
The upcoming section illustrates how to create a pivot table and manage its features and functionalities.